opsi-Nagios-Connector
Introduction
Beside client management is monitoring one the central functions in a modern IT service management. With opsi you got a client management tool. For monitoring tasks there are other well known open source solutions. So we build for the monitoring tasks in opsi not an own monitoring tool but an interface to existing solutions. With this opsi extension we provide a connector to Nagios.
In the following chapters the design and configuration of the opsi-Nagios-Connector is explained.
The opsi-Nagios-Connector isn’t strictly bound to Nagios. It is developed for the use with Nagios and Icinga. It should also work with other Nagios derivatives but this is whether tested nor supported.
The scope of this manual is the design and configuration of the opsi-Nagios-Connector. It is not a Nagios manual. You will need a running Nagios installation and the knowledge how to run Nagios.
Preconditions
Preconditions at the opsi server and client
This extension is at the moment a cofunding project which means that until the complete development costs are payed by co-funders, they are only allowed to use by the co-funders or for evaluation purposes. If we have earned the development cost we will give these modules for everybody for free.
see also
opsi extension
opsi cofunding contribution
So as precondition to use this extension you need as first an activation file.
For evaluation purpose you will get a temporary activation file if you ask for it in a mail at info@uib.de.
For more details see opsi Extensions.
Technical preconditions are opsi 4.0.2 with the following package and product versions:
| opsi package | Version |
|---|---|
opsi-client-agent |
>=4.0.2-1 |
opsiconfd |
>=4.0.2.1-1 |
python-opsi |
>=4.0.2.1-1 |
Concept
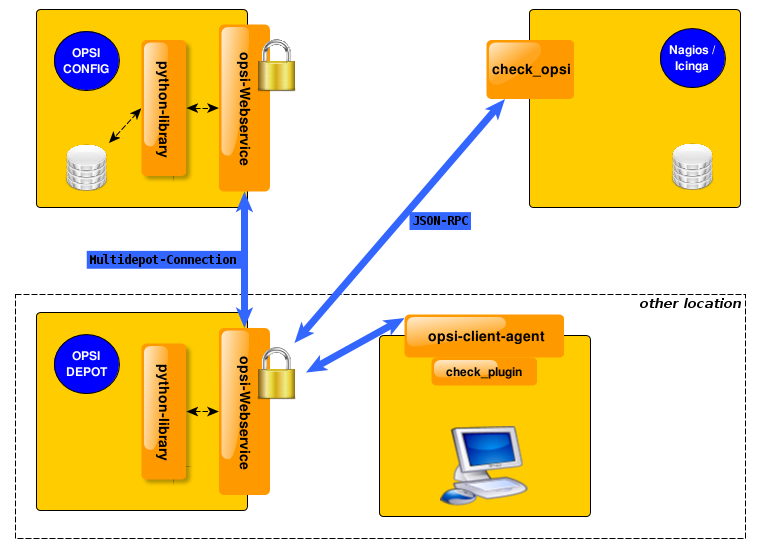
The opsi-Nagios-Connector contains of two core components. At first we will discuss these core components.
opsi web service extension
The heart of the opsi-Nagios-Connector are extended features of the opsi web service. These web service extension make it possible to run checks via web service on the opsi server. So the Nagios server calls checks via web service which are executed on the opsi-server and the results come back to the Nagios server via opsi web service. The advantage of this solution is that there is nearly nothing to do on the monitored opsi server.
The focus of the opsi web service extension lies on opsi specific checks like e.g. rollout monitoring. For the 'normal' server monitoring you should use still standard check methods.
opsi-client-agent extension
An other part of the opsi-Nagios-Connector is an extension of the opsi-client-agent.
In a opsi environment on every managed client runs a opsi-client-agent. With this extension you may use the opsi-client-agent as Nagios agent as well. But in fact not all features of a standard Nagios agent like NSClient++ are implemented at the opsi-client-agent. You may use the opsi-client-agent to run command line programs and send back the output.
If you not use all functions like NSCA but rather some standard checks per plugin on the client or a set of own plugins on the clients you can use the opsi-client-agent.
If you need more features for the client monitoring you should rollout a standard agent like NSClient++ via opsi.
The advantage of using the opsi-client-agent as Nagios agent is, that you don’t need an additional agent on the client and that you don’t need any access data for the clients at the monitoring server. These data is not needed because all check run via the opsi server. This makes the configuration a lot more easier.
opsi-checks
The following chapter explains the goals and configurations of the opsi-checks.
Some background information about where to run the checks
Monitoring administrators know the difference between active and passive checks.
With the opsi-Nagios-Connector we get a new difference: direct and indirect.
-
direct:
The check which collects information about a client runs on that client, get the information direct from the client and sends the information back. -
indirect:
The check which collects information about a client runs on the opsi server and get the information from the opsi configuration data which is stored in the opsi backend. So - this information may be different from the actual situation of the client.
A good example for an indirect check is the check-opsi-client-status. This check gives you for a given client information about pending action request and reported failures of the opsi software deployment.. So this are information about the client from the opsi servers point of view. Therefore this check runs on the opsi server and is an indirect check. A check which runs on the client is a direct check.
For a correct distribution and configuration of the checks you have to analyze your opsi installation.
According to the flexibility of opsi many various opsi configurations are possible. So here we can only explain some typical situations. Of course we will get help for special situations by our comercial support.
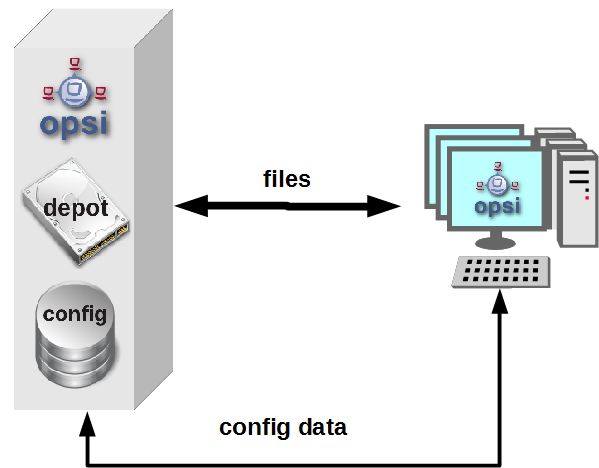
only one opsi server:
The opsi stand alone installation is the situation that you will find at the most opsi environments. At this installation the opsi config server functionality is at the same server like the (one and only) opsi depot server functionality.
This means to you, that you may ignore if a check has to be run on the config server or the depot server.
opsi with multiple depotservers:
If you have a central management of a multi location opsi environment (one config server, multiple depot servers) the situation is more complicated. So you have to understand the situation:
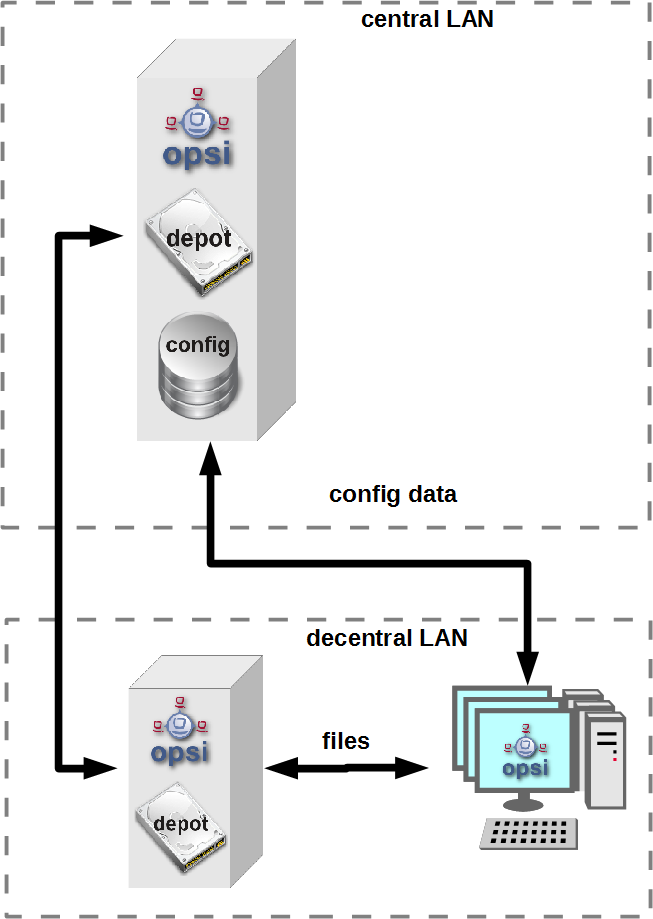
As the figure points out there is only one server which have data storage for the configuration data - the data backend. This is the opsi config server. The opsi depot server has no own data storage but a redirected backend. This means that if you ask a depot server for any configuration data, this question will be redirected to the config server. And this leads to the consequence that every check which runs against the opsi data backend will at least run on the config server. So you should address checks that run against the backend always to the config server. Even in the situation if you are collecting information about clients which are assigned to a depot which is different from the config server and the check is logically part of the check of this depot server.
If you running direct checks you normally also address the config server. You may address the depot server if the clients can’t be reached by the opsi config server via port 4441. In this case it is a good idea to address the depot server.
opsi-check-plugin
At the nagios server there is only one opsi-check-plugin which provides a wide range of different checks. According to the number of features there is also a big number of command line options. So - just list all these options won’t help you much. Instead the option will be explained in the context of documentation of the possible checks.
How ever to get a listing of all options you may call check_opsi with the parameters --help or -h.
The following general options are needed for every check:
Option |
Description |
Example |
-H,--host |
opsi server which should run the check |
configserver.domain.local |
-P,--port |
opsi webservice port |
4447 (Default) |
-u,--username |
opsi monitoring user |
monitoring |
-p,--password |
opsi monitoring password |
monitoring123 |
-t,--task |
opsi check method (case sensitive) |
The following chapter describes how to call the opsi-check-plugin is called on the command line. How you have to configure these calls at your Nagios server is described at the chapter 'configuration'.
In order to install the opsi-check-plugin on your Nagios server you should add the opsi repository to your server and install the package 'opsi-nagios-plugins'.
For example at Debian or Ubuntu with the following commands:
apt-get install opsi-nagios-pluginsOn RedHat/Centos Servers please use the follwing command:
yum install opsi-nagios-pluginsAnd last but not least for openSUSE/SLES Installations:
zypper install opsi-nagios-pluginsThe plugin it self is written in python and should ran at any distribution.
The package bases on the package 'nagios-plugins-basic' respectivly 'nagios-plugins' and installs the plugin to /usr/lib/nagios/plugins.
According to the flexibility of the check_plugin there is no automatic configuration.
Check: opsi web service
This check monitors the opsi web service process (opsiconfd). This check returns also performance data. You should run this check on every opsi server because every opsi server have a opsiconfd process.
check_opsi -H configserver.domain.local -P 4447 -u monitoring -p monitoring123 -t checkOpsiWebserviceThis check return normally OK.
You will get other return values in the following situations:
-
Critical:
-
If the opsiconfd is in trouble and can’t reply correctly.
-
If the opsiconfd consumes more than 80% of the cpu.
-
If you have a rate of RPC errors of more than 20%.
-
-
Warning:
-
If the opsiconfd consumes more than 60% (but less than 80%) of the cpu.
-
If you have a rate of RPC errors of more than 10% but less than 20%
-
-
Unknown:
The opsi web service could not be reached.
NOTICE: The percentage value of the cpu consumption belongs always to one cpu because the opsiconfd only may use one cpu. (This may change with the opsi multi processing extension)
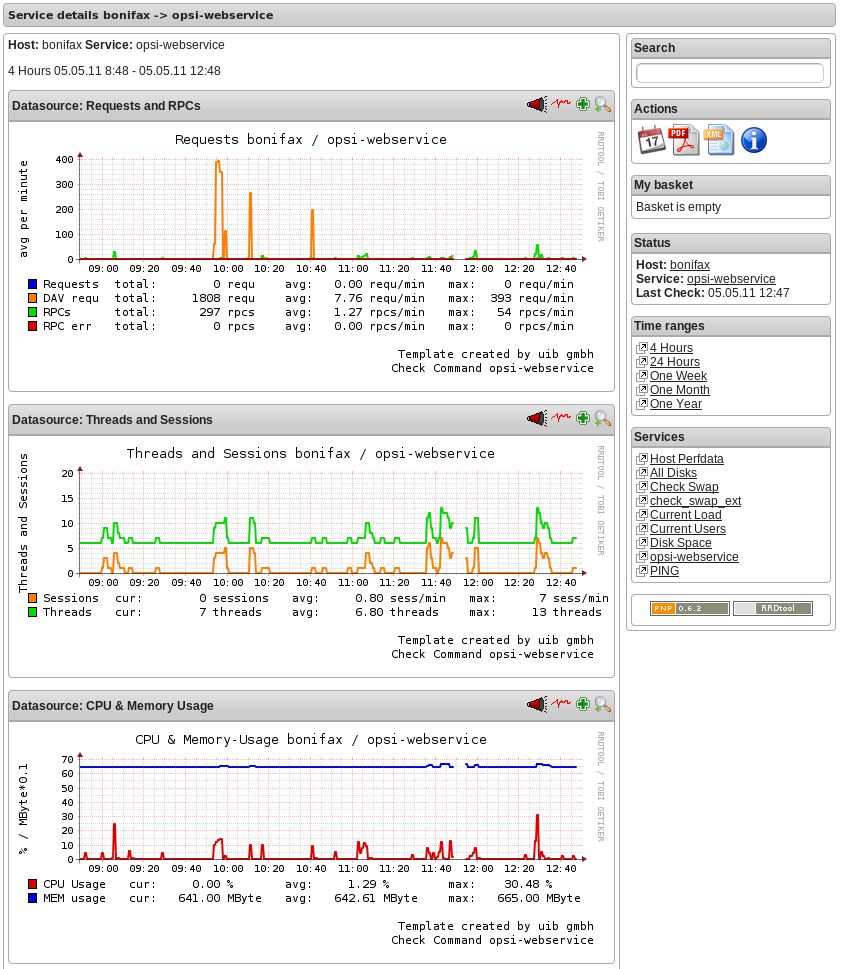
Check: opsi web service pnp4nagios template
For the display of performance data there is a template for pnp4nagios which displays the data in a combined way.
Here is not described how to install pnp4nagios. We assume that pnp4nagios is installed and configured correctly. The way you have to use to configure our template may differ from the below described way according to your pnp4nagios installation (which may use different path).
Standard templates display for every performance data an own diagram. To create a combined display you have to go the following steps:
Step 1:
create at /etc/pnp4nagios/check_commands a file named check_opsiwebservice.cfg and insert the following content:
CUSTOM_TEMPLATE = 0
DATATYPE = ABSOLUTE,ABSOLUTE,ABSOLUTE,ABSOLUTE,DERIVE,GAUGE,GAUGE,GAUGE
Setp 2:
change to the directory /usr/share/pnp4nagios/html/templates and place there a file check_opsiwebservice.php which you check out from svn.opsi.org:
cd /usr/share/pnp4nagios/html/templates
svn co https://svn.opsi.org/opsi-pnp4nagios-template/trunk/check_opsiwebservice.php
Please check that your php file is named exactly like the 'command_name' which is defined at the /etc/nagios3/conf.d/opsi/opsicommands.cfg. If the names don’t match, a standard template will be used instead our combined template.
After installing this template you should delete the RRD data bases which belong to this check (if there any existing). You will find these data bases at /var/pnp4nagios/perfdata/<host>/ where you should (only) delete the opsi-webservice.rrd and opsi-webservice.xml files.
If you have configured everything correctly you should now able to see diagrams like the following screenshot.
Check: opsi-check-diskusage
This check monitors the usage of the resources (directories) which are used by opsi. The following table shows the resource names and the corresponding directories:
Resource name |
Path |
/ |
/usr/share/opsiconfd/static |
configed |
/usr/lib/configed |
depot |
/var/lib/opsi/depot |
repository |
/var/lib/opsi/repository |
Please note that this check monitors only opsi relevant data and do replace a general disk usage check for the server.
The following command retrieves all resources at one time:
check_opsi -H configserver.domain.local -P 4447 -u monitoring -p monitoring123 -t checkOpsiDiskUsageIn addition to this standard variant you may restrict the check to the resource repository:
check_opsi -H configserver.domain.local -P 4447 -u monitoring -p monitoring123 -t checkOpsiDiskUsage --resource repositoryThe default result value of this check is 'OK' and the free space of the resources. The free space is given in Gigabyte. The default values for the 'Warning' and 'Critical' results are:
-
WARNING: If at least one resource have 5GB or less free space.
-
CRITICAL: If at least one resource have 1GB or less free space.
This are the default thresholds. They may changed by giving other values for 'Warning' with the -W or --warning options and for 'Critical' wit the -C or --critical option. With these options you can give the thresholds as Gigabyte (G) and as percent (%) as well. The produced output uses the same unit which is used to define the thresholds.
Finally an example:
check_opsi -H configserver.domain.local -P 4447 -u monitoring -p monitoring123 -t checkOpsiDiskUsage --resource repository --warning 10% --critical 5%Check: opsi-client-status
One of the targets of the opsi Nagios connector is the software roll out monitoring by viewing to single clients. This is one of the checks which is designed for this job. More exactly: the 'software roll out' and 'last seen' situation of a certain client is checked.
The result of the following checks is determined by two different states:
-
The roll out state of one or more software products:
The software roll out state results to:-
'OK' if the software is installed at the in the same product and package version which is available at the server and no action request is set.
-
'Warning' if the software is installed in version that is different to the servers version or if any action request is set.
-
'Critical' if there is a 'failed' reported by the last action.
-
-
The time since 'last seen':
The time since 'last seen' results to:-
'OK' if the client has bee seen less or equal then 30 days before.
-
'Warning' if the client has bee seen more then 30 days before.
-
This check may used in different variants, here is the simplest one, which includes all software packages:
check_opsi -H configserver.domain.local -P 4447 -u monitoring -p monitoring123 -t checkClientStatus -c opsiclient.domain.localAs variant it is possible to exclude products from the check. For example:
check_opsi -H configserver.domain.local -P 4447 -u monitoring -p monitoring123 -t checkClientStatus -c opsiclient.domain.local -x firefoxIn the example above the product 'firefox' was excluded from the check. So this check would not switch to critical because the last action on 'firefox' reported a failure.
Check: opsi-check-ProductStatus
An other target of the opsi Nagios connector is the software roll out monitoring by viewing to single product or a group of products.
The result of the following checks is determined by the following states:
The software roll out state results to: * 'OK' if the software is installed at the in the same product and package version which is available at the server and no action request is set. * 'Warning' if the software is installed in version that is different to the servers version or if any action request is set. * 'Critical' if there is a 'failed' reported by the last action.
This checks has many variants and is so very flexible. The bast way to explain these variants are examples.
The simplest variant check one product on all clients. Here you have to give the product as the opsi productId.
check_opsi -H configserver.domain.local -P 4447 -u monitoring -p monitoring123 -t checkProductStatus -e firefoxIn a simple one server opsi environment, this check is all you need to check the state of the product 'firefox' on every client.
You will get the information how many clients are in 'Warning' and in 'Critical' states.
To get the information which clients exactly have the problems, you should call the check in the verbose mode:
check_opsi -H configserver.domain.local -P 4447 -u monitoring -p monitoring123 -t checkProductStatus -e firefox -vAn other variant is, that you may exclude a client from the check.
//// produkt muss angegebn werden ?! ////
check_opsi -H configserver.domain.local -P 4447 -u monitoring -p monitoring123 -t checkProductStatus -e firefox -x client.domain.localIn a opsi environment with multiple depot servers you have to use additional options to check also the clients that are not assigned to the config servers depot. If you have multiple depots, you may give the depots name as parameter:
check_opsi -H configserver.domain.local -P 4447 -u monitoring -p monitoring123 -t checkProductStatus -e firefox -d depotserver.domain.localThe reason is that the version of the software packages may differ between your depots. So every client has to be checked against the versions at the depot where they are assigned to. An advantage is that can place the display of the results to the depot server.
You may give instead of the depot servers name the keyword 'all' which means all known depot servers. But this normally make only sense if you have only one or two depots. You may also give a comma separated list of depot servers.
An other way to define the checks is to give the name of a opsi groups. So you may check the software roll out state of all products in a given opsi product group. If you have for example a product group 'accounting' you may use the following call:
check_opsi -H configserver.domain.local -P 4447 -u monitoring -p monitoring123 -t checkProductStatus -g accountingNow you will check all products that are Members of the opsi product group 'accounting' by this single check. Important is to see, that the resolution of the opsi group is done while the check at the opsi server. So you may change the opsi group at the opsi Management interface and so you will change the products that will checked without any changes at the Nagios server.
| Sub groups (groups in groups) will not be resolved. |
In the same way it is possible to define the clients that should be checked by giving the name of a opsi client group.
An example for a client group 'productiveclients':
check_opsi -H configserver.domain.local -P 4447 -u monitoring -p monitoring123 -t checkProductStatus -g accounting -G productiveclientsThis would check all products of the product group 'accounting' at all clients of the client group 'productiveclients'.
| Sub groups (groups in groups) will not be resolved. |
| You may also give a comma separated list of opsi groups. |
Finally opsi-Clients can be excluded:
check_opsi -H configserver.domain.local -P 4447 -u monitoring -p monitoring123 -t checkProductStatus -g buchhaltung -G produktivclients -x client.domain.localCheck: opsi-check-depotsync
If you are using multiple opsi depots the monitoring of synchronicity is important. Even if your depots are for good reasons not completely synchronize they should be synchrony as much as possible to avoid problems by moving a client from one depot to another.
This check monitors if your depots are synchronize according to product ids, product versions and package versions.
This check returns:
-
'OK'
If all is in sync. -
'Warning'
If there is any difference
You should run this check always on the config server because all the data come from the backend of the config server.
Here are some examples.
The base variant:
check_opsi -H configserver.domain.local -P 4447 -u monitoring -p monitoring123 -t checkOpsiDepotSyncStatusThis base variant is equivalent to the following call:
check_opsi -H configserver.domain.local -P 4447 -u monitoring -p monitoring123 -t checkOpsiDepotSyncStatus -d allSo if you don’t give the depots which are have to be checked, all known depots will be checked. If you have a lot of depots the interpretation of the result is complicated, so it is a good idea to define a lot of single checks where the depots are given as comma separated list:
check_opsi -H configserver.domain.local -P 4447 -u monitoring -p monitoring123 -t checkOpsiDepotSyncStatus -d configserver.domain.local,depotserver.domain.localWith this check you compare all products, that are installed on both depots. Any product which is installed only on one of the depot is ignored and will not effect the result.
If you want to include products which are not installed on all checked depots, you have to use the strictmode switch:
check_opsi -H configserver.domain.local -P 4447 -u monitoring -p monitoring123 -t checkOpsiDepotSyncStatus -d configserver.domain.local,depotserver.domain.local --strictmodeNow also differences about missing products will be seen.
If you like to exclude a product from the check (perhaps because this product should be in different versions on different depots) you may do this by using the -x option. Here you may also use a comma separated list:
check_opsi -H configserver.domain.local -P 4447 -u monitoring -p monitoring123 -t checkOpsiDepotSyncStatus -d configserver.domain.local,depotserver.domain.local --strictmode -x firefox,thunderbirdThis check will not warn if the products 'firefox' or 'thunderbird' or not in sync.
Instead of excluding products you may give an explicit list of products that has to been checked:
check_opsi -H configserver.domain.local -P 4447 -u monitoring -p monitoring123 -t checkOpsiDepotSyncStatus -d configserver.domain.local,depotserver.domain.local --strictmode -e firefox,thunderbirdIn this case only 'firefox' and 'thunderbird' will be checked. We recommend to use this check variant with strictmode to see if one of the products is missing.
check_opsi -H configserver.domain.local -P 4447 -u monitoring -p monitoring123 -t checkOpsiDepotSyncCheck: Locked products on depots
During the installation of a new opsi package on an opsi server a lock will be set for the product on the depot. Once the installation has been successfully completed the lock will be removed. The duration of an opsi package can sometime require an usual amount of time without failing. If the lock is kept for a long time then this can be an indication of installation problems.
This check searches for existing locks on your depots.
This check returns:
-
'OK'
If there aren’t currently any locked products on opsi-servers. -
'Warning'
If there is at least one locked product on an opsi-server.
You should run this check always on the config server because all the data comes from the backend of the config server.
This check requires at least the following versions:
| package | version |
|---|---|
opsi-nagios-plugins |
>=4.1.1.1 |
opsiconfd |
>=4.1.1.11 |
Basic check execution:
check_opsi -H configserver.domain.local -P 4447 -u monitoring -p monitoring123 --task checkProductLocksThis is equivalent to the following call:
check_opsi -H configserver.domain.local -P 4447 -u monitoring -p monitoring123 --task checkProductLocks -d allIf you want to limit the checks to specific depots you have to supply them as a comma separated list. The result can get harder to interpret if the output for multiple servers is mixed and our recommendation is to define a check per depot.
The following example checks for the two depots 'configserver.domain.local' and 'depotserver.domain.local':
check_opsi -H configserver.domain.local -P 4447 -u monitoring -p monitoring123 --task checkProductLocks --depotIds configserver.domain.local,depotserver.domain.localBy default all products will be checked It is possible to only limit the check to specific products. This takes a comma-separated list of product IDs.
This example will check two specific servers and limit the check to the products 'opsi-client-agent' and 'opsi-winst':
check_opsi -H configserver.domain.local -P 4447 -u monitoring -p monitoring123 --task checkProductLocks --depotIds configserver.domain.local,depotserver.domain.local --productIds opsi-client-agent,opsi-winstCheck: nagios client plugin check via opsiclientd
This check gives you an easy possibility to integrate checks that collects the data direct on the client with a minimum of configuration work.
So this check tells the opsiclientd which is running at the opsi client to run a command, fetch the output and send it back.
This extension is not intended to be a complete replacement of a full featured Windows Nagios agent. It is only a light weight alternative.
The plugins which the opsiclientd may call must be compatible to the Nagios plug-in development guidelines.
In order to run such a plugin on the client, it has to be installed at the client. This problem you will solve by deploying it as an opsi package. The path where the plugin is installed at client doesn’t matter because you have to give the complete path at check definition. We recommend to install all plugins in one directory to ease the maintenance of the plugins at the client.
For security reasons you should make sure that non privileged users have no write access to the plugins, because they will be executed from the opsiclientd with 'system' privileges.
There are lot of ready to use plugins at the internet. One important address to look is:
http://exchange.nagios.org/
In the following we assume that your plugins are installed at C:\opsi.org\nagiosplugins\ and we will find ther the plugin check_win_disk.exe out of the package 'nagioscol' from
http://sourceforge.net/projects/nagiosplugincol/
check_opsi -H configserver.domain.local -P 4447 -u monitoring -p monitoring123 -t checkPluginOnClient --plugin "C:\\opsi.org\\nagiosplugincol\\check_win_disk.exe C:" -c client.domain.localThis call checks the client client.domain.local. At the client the plugin check_win_disk.exe is called with the parameter C:. This means, that the hard drive with the letter 'C' should be checked. The output and the result value of the plugin will be fetched by the opsiclientd and will be given back to the Nagios server (via the opsi server) in a for Nagios correct format.
Another special feature is to hold the last check results, even if the client is not reachable.
This feature was implemented according to the fact that desktop clients not always are running like servers, but the most time in their life are usually switched off. Normally Nagios will show for switched off clients the result 'Unknown'. In fact the most problems on the monitored clients will not disappear by just switching them off and on again. So the information that a client had a problem before it was switched off may be an essential information for the system administrator. (You may try to solve this problem by using Timeperiods at the Nagios configuration, but we think that this is not flexible enough and leads to a permanent configuration work). So this opsi extension give you the possibility to give back the last real check results if the client is not reachable right now.
In order to use this feature, you have to use the Nagios macros $SERVICESTATEID$ and $SERVICEOUTPUT$. $SERVICESTATEID$ gives the last result value and should be passed to the -s Option. $SERVICEOUTPUT$ gives the last output line and should be passed to the -o Option. So check can give these last values instead of 'Unknown' if the client is not reachable.
check_opsi -H configserver.domain.local -P 4447 -u monitoring -p monitoring123 -t checkPluginOnClient --plugin "C:\\opsi.org\\nagiosplugincol\\check_win_disk.exe C:" -c client.domain.local -s $SERVICESTATEID$ -o $SERVICEOUTPUT$opsi monitoring configuration
This chapter focuses on the configuration that have to been made for a working interface between the opsi and the Nagios server. Just see this as a recommendation, there will be a lot of other ways to do the job.
This description uses a Nagios server as monitoring server. On a Icinga server it should work very similar but you have to change some path entries. It should also work on other Nagios derivatives but this is not tested.
|
The configurationfiles from these Chapter are in opsi-nagios-connector-utils svn-Repository. To get these example configurationfiles you can connect over a browser to following url: or you can make a direct checkout from repository with following command: |
opsi monitoring user
In monitoring environments you will often find that the access is just restricted by IP numbers. Because of the lack of security of this solution we decided to work with a real user / password security in this opsi extension.
Using the opsi standard group opsiadmin would give the Nagios more rights than needed. So you have to create an own opsi user for the opsi-Nagios-Connector.
In the following example a user named 'monitoring' with the password 'monitoring123' is created for opsi:
opsi-admin -d method user_setCredentials monitoring monitoring123The created user 'monitoring' will be stored with its encrypted password at the /etc/opsi/passwd and is not a user which may be used to login at a shell. In fact it is no real Unix user.
You have to create this user only on your config server, even if you have multiple depots.
At your Nagios server you should mask the user and password by making an entry at the /etc/nagios3/resource.cfg. This should look for example like this:
$USER2$=monitoring
$USER3$=monitoring123
The number behind '$USER' may vary. If this configuration was not used before, there should be only $USER1$ be used. According to what you are using here, you might have to change the other examples in this manual.
opsi-Nagios-Connector configuration directory
To make the maintenance of the Nagios configuration easier, we recommend to put all 'opsi nagios connector' related configuration files in one separated place.
So just create below /etc/nagios3/conf.d a new directory named opsi for these configurations.
The configuration files we will place in this directory are:
-
Nagios Template:
opsitemplates.cfg -
Hostgroups:
opsihostgroups.cfg -
Server Hosts:
<full name of the server>.cfg -
Commands:
opsicommands.cfg -
Contacts:
opsicontacts.cfg -
Services:
opsiservices.cfg
All the client configuration files we recommend to put in sub directory of this place. Therefore you create below /etc/nagios3/conf.d/opsi another directory named clients.
Nagios template: opsitemplates.cfg
Using templates is a standard functionality of Nagios which will not explained here. The main advantage is that it makes the single configuration files smaller and easier to read (and write).
Inside of the templates we use some Nagios 'custom variables' for often used values. According to the fact, that the most checks have to run on the opsi config server, we will define the name and port of the config server as such a 'custom variable':
_configserver           configserver.domain.local
_configserverurl        4447
You will find this below in the template definitions.
These 'custom variables' may later on be referenced by the Nagios macros: $_HOSTCONFIGSERVER$ and $_HOSTCONFIGSERVERPORT$. (These macros have leading 'HOST' in their name, because they are defined inside of a host definition).
For more details on variable and macro take look at your Nagios documentation.
Now the first file we create in /etc/nagios3/conf.d/opsi is the template definition file opsitemplates.cfg.
This file may hold different templates. Every template is created according to the following patter (which contains comments for better understanding):
define host{
        name                    opsihost-tmp    ; The name of this host template
        notifications_enabled           1       ; Host notifications are enabled
        event_handler_enabled           1       ; Host event handler is enabled
        flap_detection_enabled          1       ; Flap detection is enabled
        failure_prediction_enabled      1       ; Failure prediction is enabled
        process_perf_data               0       ; Process performance data
        retain_status_information       1       ; Retain status information across program restarts
        retain_nonstatus_information    1       ; Retain non-status information across program restarts
                max_check_attempts              10
                notification_interval           0
                notification_period             24x7
                notification_options            d,u,r
                contact_groups                  admins
        register                        0       ; DONT REGISTER THIS DEFINITION - ITS NOT A REAL HOST, JUST A TEMPLATE!
        icon_image                      opsi/opsi-client.png
        }
NOTE:
* The optional option icon_image may put it to an image with relative path below: /usr/share/nagios3/htdocs/images/logos/.
* Optional you may give an own 'contact_group', which have to be defined as contact object, for example in the file opsicontacts.cfg.
Now we recommend to create templates for the following objects
-
opsi server
-
opsi client
-
opsi service
-
and 2 templates for pnp4nagios (host-pnp / srv-pnp)
Let’s start with the example of the opsi server template:
define host{
        name                            opsi-server-tmpl
        notifications_enabled           1
        event_handler_enabled           1
        flap_detection_enabled          1
        failure_prediction_enabled      1
        process_perf_data               1
        retain_status_information       1
        retain_nonstatus_information    1
                check_command                   check-host-alive
                max_check_attempts              10
                notification_interval           0
                notification_period             24x7
                notification_options            d,u,r
                contact_groups                  admins,opsiadmins
        _configserver                   configserver.domain.local
        _configserverport               4447
        register                        0
        icon_image                      opsi/opsi-client.png
        }
You just have to change 'configserver.domain.local' to your config server name. Also you may change the 'contact_groups' to your needs.
The next part of the file opsitemplates.cfg is the template for the clients:
define host{
        name                            opsi-client-tmpl
        notifications_enabled           1
        event_handler_enabled           1
        flap_detection_enabled          1
        failure_prediction_enabled      1
        process_perf_data               1
        retain_status_information       1
        retain_nonstatus_information    1
                max_check_attempts              10
                notification_interval           0
                notification_period             24x7
                notification_options            d,u,r
                contact_groups                  admins,opsiadmins
        _configserver                   configserver.domain.local
        _configserverport               4447
        register                        0
        icon_image                      opsi/opsi-client.png
        }
The Option "check command check-host-alive" should be not set here because the clients are not always running. In effect the clients will be displayed as 'pending' instead of 'offline'.
You just have to change 'configserver.domain.local' to your config server name. Also you may change the 'contact_groups' to your needs.
The next part of the file opsitemplates.cfg is the template for the opsi-services:
define service{
        name                            opsi-service-tmpl
        active_checks_enabled           1
        passive_checks_enabled          1
        parallelize_check               1
        obsess_over_service             1
        check_freshness                 0
        notifications_enabled           1
        event_handler_enabled           1
        flap_detection_enabled          1
        failure_prediction_enabled      1
        process_perf_data               1
        retain_status_information       1
        retain_nonstatus_information    1
                notification_interval           0
                is_volatile                     0
                check_period                    24x7
                normal_check_interval           5
                retry_check_interval            1
                max_check_attempts              4
                notification_period             24x7
                notification_options            w,u,c,r
                contact_groups                  admins,opsiadmins
        register                        0
        }
If you are using pnp4nagios for the graphic display of performance data you will need two other templates in the file opsitemplates.cfg:
define host {
   name       host-pnp
   action_url /pnp4nagios/index.php/graph?host=$HOSTNAME$&srv=_HOST_
   register   0
}

define service {
   name       srv-pnp
   action_url /pnp4nagios/index.php/graph?host=$HOSTNAME$&srv=$SERVICEDESC$
   register   0
}
opsi hostgroup: opsihostgroups.cfg
The nest step is to define the hostgroups. This helps to structure the display of the results as well as the service definitions.
So create a file named opsihostgroups.cfg wit the following content:
define hostgroup {
        hostgroup_name  opsi-clients
        alias           OPSI-Clients
}

define hostgroup {
        hostgroup_name  opsi-server
        alias           OPSI-Server
        members         configserver.domain.local, depotserver.domain.local
}
Do not forget to edit the 'member' line.
opsi server: <full name of the server>.cfg
The next step is to create for every opsi server you are running an own configuration file. This file should be named based on the pattern <full name of the server>.cfg. For example configserver.domain.local.cfg.
(You may also create one file (e.g. opsihost.cfg with all server definitions).
The content should look like this:
define host{
        use				opsi-server-tmpl
        host_name		configserver.domain.local
        hostgroups		opsi-server
        alias				opsi Configserver
        address			configserver.domain.local
        }

define host{
        use				opsi-server-tmpl
        host_name		depotserver.domain.local
        hostgroups		opsi-server
        alias				opsi Depotserver
        address			depotserver.domain.local
        }
Explanation of the entries: * 'use' references to the used template. * 'hostgroups' tells us to which hostgroup this server belongs.
opsi Clients: clients/<full name of the client>.cfg
The opsi client configurations should be placed in an own sub directory. They should be defined like this:
define host{
        use				opsi-client-tmpl
        host_name		client.domain.local
        hostgroups		opsi-clients
        alias				opsi client
        address			client.domain.local
        _depotid			depotserver.domain.local
        }
This client configuration uses again a 'custom variable': _depotid. This 'custom variable' may be referenced by the macro $_HOSTDEPOTID$.
The usage is optional. If a client may be not connected by the opsi configuration server directly, you will here write down from which depot server the client can be contacted.
To make it easier to create the configuration files for your large number of opsi clients, you may run the following script on your opsi configuration server:
#!/usr/bin/env python

from OPSI.Backend.BackendManager import *

template = '''
define host {
        use             opsi-client-tmpl
        host_name       %hostId%
        hostgroups      opsi-clients
        alias           %hostId%
        address         %hostId%
        }
'''

backend = BackendManager(
             dispatchConfigFile = u'/etc/opsi/backendManager/dispatch.conf',
             backendConfigDir   = u'/etc/opsi/backends',
             extensionConfigDir = u'/etc/opsi/backendManager/extend.d',
                        )


hosts = backend.host_getObjects(type="OpsiClient")

for host in hosts:
        filename = "%s.cfg" % host.id
        entry = template.replace("%hostId%",host.id)
        f = open(filename, 'w')
        f.write(entry)
        f.close()
opsi command configuration: opsicommands.cfg
Now we have to define which of the check commands, which are described before, we want to use. You should do this in a file named opsicommands.cfg.
This is just an example which you may change to your needs:
First let us explain the structure of the entries:
define command{
        command_name	check_opsi_clientstatus
        command_line		$USER1$/check_opsi -H $_HOSTCONFIGSERVER$ -P $_HOSTCONFIGSERVERPORT$ -u $USER2$ -p $USER3$ -t checkClientStatus -c $HOSTADDRESS$
        }
The command_name will be used by other configuration files. The option command_line defines the command and all used arguments.
Based on this pattern we create now the file opsicommands.cfg:
define command {
        command_name    check_opsiwebservice
        command_line    /usr/lib/nagios/plugins/check_opsi -H $HOSTADDRESS$ -P 4447 -u $USER2$ -p $USER3$ -t checkOpsiWebservice
}
define command {
        command_name    check_opsidiskusage
        command_line    /usr/lib/nagios/plugins/check_opsi -H $HOSTADDRESS$ -P $_HOSTCONFIGSERVERPORT$ -u $USER2$ -p $USER3$ -t checkOpsiDiskUsage
}
define command {
        command_name    check_opsiclientstatus
        command_line    /usr/lib/nagios/plugins/check_opsi -H $_HOSTCONFIGSERVER$ -P $_HOSTCONFIGSERVERPORT$ -u $USER2$ -p $USER3$ -t checkClientStatus -c $HOSTADDRESS$
}
define command {
        command_name    check_opsiproductstatus
        command_line    /usr/lib/nagios/plugins/check_opsi -H $_HOSTCONFIGSERVER$ -P $_HOSTCONFIGSERVERPORT$ -u $USER2$ -p $USER3$ -t checkProductStatus -e $ARG1$ -d $HOSTADDRESS$ -v
}
define command {
        command_name    check_opsiproductStatus_withGroups
        command_line    /usr/lib/nagios/plugins/check_opsi -H $_HOSTCONFIGSERVER$ -P $_HOSTCONFIGSERVERPORT$ -u $USER2$ -p $USER3$ -t checkProductStatus -g $ARG1$ -G $ARG2$ -d "all"
}
define command {
        command_name    check_opsiproductStatus_withGroups_long
        command_line    /usr/lib/nagios/plugins/check_opsi -H $_HOSTCONFIGSERVER$ -P $_HOSTCONFIGSERVERPORT$ -u $USER2$ -p $USER3$ -t checkProductStatus -g $ARG1$ -G $ARG2$ -v -d "all"
}
define command {
        command_name    check_opsidepotsync
        command_line    /usr/lib/nagios/plugins/check_opsi -H $_HOSTCONFIGSERVER$ -P $_HOSTCONFIGSERVERPORT$ -u $USER2$ -p $USER3$ -t checkDepotSyncStatus -d $ARG1$
}
define command {
        command_name    check_opsidepotsync_long
        command_line    /usr/lib/nagios/plugins/check_opsi -H $_HOSTCONFIGSERVER$ -P $_HOSTCONFIGSERVERPORT$ -u $USER2$ -p $USER3$ -t checkDepotSyncStatus -d $ARG1$ -v
}
define command {
        command_name    check_opsidepotsync_strict
        command_line    /usr/lib/nagios/plugins/check_opsi -H $_HOSTCONFIGSERVER$ -P $_HOSTCONFIGSERVERPORT$ -u $USER2$ -p $USER3$ -t checkDepotSyncStatus -d $ARG1$ --strict
}
define command {
        command_name    check_opsidepotsync_strict_long
        command_line    /usr/lib/nagios/plugins/check_opsi -H $_HOSTCONFIGSERVER$ -P $_HOSTCONFIGSERVERPORT$ -u $USER2$ -p $USER3$ -t checkDepotSyncStatus -d $ARG1$ --strict -v
}
define command {
        command_name    check_opsipluginon_client
        command_line    /usr/lib/nagios/plugins/check_opsi -H $_HOSTCONFIGSERVER$ -P $_HOSTCONFIGSERVERPORT$ -u $USER2$ -p $USER3$ -t checkPluginOnClient -c $HOSTADDRESS$ --plugin $ARG1$
}
define command {
        command_name    check_opsipluginon_client_with_states
        command_line    /usr/lib/nagios/plugins/check_opsi -H $_HOSTCONFIGSERVER$ -P $_HOSTCONFIGSERVERPORT$ -u $USER2$ -p $USER3$ -t checkPluginOnClient -c $HOSTADDRESS$ --plugin $ARG1$ -s $SERVICESTATEID$ -o "$SERVICEOUTPUT$"
}
define command {
        command_name    check_opsipluginon_client_from_depot
        command_line    /usr/lib/nagios/plugins/check_opsi -H $_HOSTDEPOTID$ -P $_HOSTCONFIGSERVERPORT$ -u $USER2$ -p $USER3$ -t checkPluginOnClient -c $HOSTADDRESS$ --plugin $ARG1$
}
Contacts: opsicontacts.cfg
This define the contacts which will get notifications.
define contact{
        contact_name                    adminuser
        alias                           Opsi
        service_notification_period     24x7
        host_notification_period        24x7
        service_notification_options    w,u,c,r
        host_notification_options       d,r
        service_notification_commands   notify-service-by-email
        host_notification_commands      notify-host-by-email
        email                           root@localhost
        }
define contactgroup{
        contactgroup_name       opsiadmins
        alias                   Opsi Administrators
        members                 adminuser
        }
You should replace 'adminuser' by one or more real users.
Services: opsiservices.cfg
Finally we define with the 'services' what the Nagios server have to monitor and to display. This definition are using the definition of the other configuration file above like templates, commands and hostgroups or hosts.
As first part we define the services which give us information’s about the servers. One of these is the check if the depots are in sync, which is here down against 'all' known depots.
#OPSI-Services
define service{
        use                             opsi-service-tmpl,srv-pnp
        hostgroup_name                  opsi-server
        service_description             opsi-webservice
        check_command                   check_opsiwebservice
        check_interval                  1
        }
define service{
        use                             opsi-service-tmpl
        hostgroup_name                  opsi-server
        service_description             opsi-diskusage
        check_command                   check_opsidiskusage
        check_interval                  1
        }
define service{
        use                             opsi-service-tmpl
        hostgroup_name                  opsi-server
        service_description             opsi-depotsyncstatus-longoutput
        check_command                   check_opsidepotsync_long!all
        check_interval                  10
        }
define service{
        use                             opsi-service-tmpl
        hostgroup_name                  opsi-server
        service_description             opsi-depotsyncstatus-strict-longoutput
        check_command                   check_opsidepotsync_strict_long!all
        check_interval                  10
        }
The next part is the monitoring of the software roll out. In one check a concrete opsi product 'opsi-client-agent' is mentioned. In two other check are referenced on a opsi product group 'opsiessentials' and opsi client group 'productiveclients'.
define service{
        use                             opsi-service-tmpl
        hostgroup_name                  opsi-clients
        service_description             opsi-clientstatus
        check_command                   check_opsiclientstatus
        check_interval                  10
        }
define service{
        use                             opsi-service-tmpl
        hostgroup_name                  opsi-server
        service_description             opsi-productstatus-opsiclientagent
        check_command                   check_opsiproductstatus!opsi-client-agent
        check_interval                  10
        }
define service{
        use                             opsi-service-tmpl
        hostgroup_name                  opsi-server
        service_description             opsi-productstatus-opsiessentials-group
        check_command                   check_opsiproductStatus_withGroups!opsiessentials!productiveclients
        check_interval                  10
        }
define service{
        use                             opsi-service-tmpl
        hostgroup_name                  opsi-server
        service_description             opsi-productstatus-opsiessentials-group-longoutput
        check_command                   check_opsiproductStatus_withGroups_long!opsiessentials!productiveclients
        check_interval                  10
        }
In the third and last part of the file, the checks which are should run directly on the clients ('direct checks') are defined.
These checks are (for example) not assigned to hostgroups but to single hosts or lists of hosts ('client.domain.local','depotclient.domain.local').
Some description:
-
'opsi-direct-checkpluginonclient'
runs a normal 'direct' check on the client and results to 'unknown' if the client is offline.
At this check the config server try’s to reach the client directly. -
'opsi-direct-checkpluginonclient-with-servicestate'
is equal to 'opsi-direct-checkpluginonclient', but returns the last valid result if the client is offline (instead of 'unknown') -
'opsi-direct-checkpluginonclient-from-depot'
is equal to 'opsi-direct-checkpluginonclient', but the client will be connected by the server which is given in the host configuration as '_depotid'.
define service{
        use                             opsi-service-tmpl
        host_name                       client.domain.local,depotclient.domain.local
        service_description             opsi-direct-checkpluginonclient
        check_command                   check_opsipluginon_client!"C:\\opsi.org\\nagiosplugins\\check_memory.exe"
        check_interval                  10
        }
define service{
        use                             opsi-service-tmpl
        host_name                       client.domain.local
        service_description             opsi-direct-checkpluginonclient-with-servicestate
        check_command                   check_opsipluginon_client_with_states!"C:\\opsi.org\\nagiosplugins\\check_memory.exe"
        check_interval                  10
        }
define service{
        use                             opsi-service-tmpl
        host_name                       depotclient.domain.local
        service_description             opsi-direct-checkpluginonclient-from-depot
        check_command                   check_opsipluginon_client_from_depot!"C:\\opsi.org\\nagiosplugins\\check_memory.exe"
        check_interval                  10
        }