Grafana
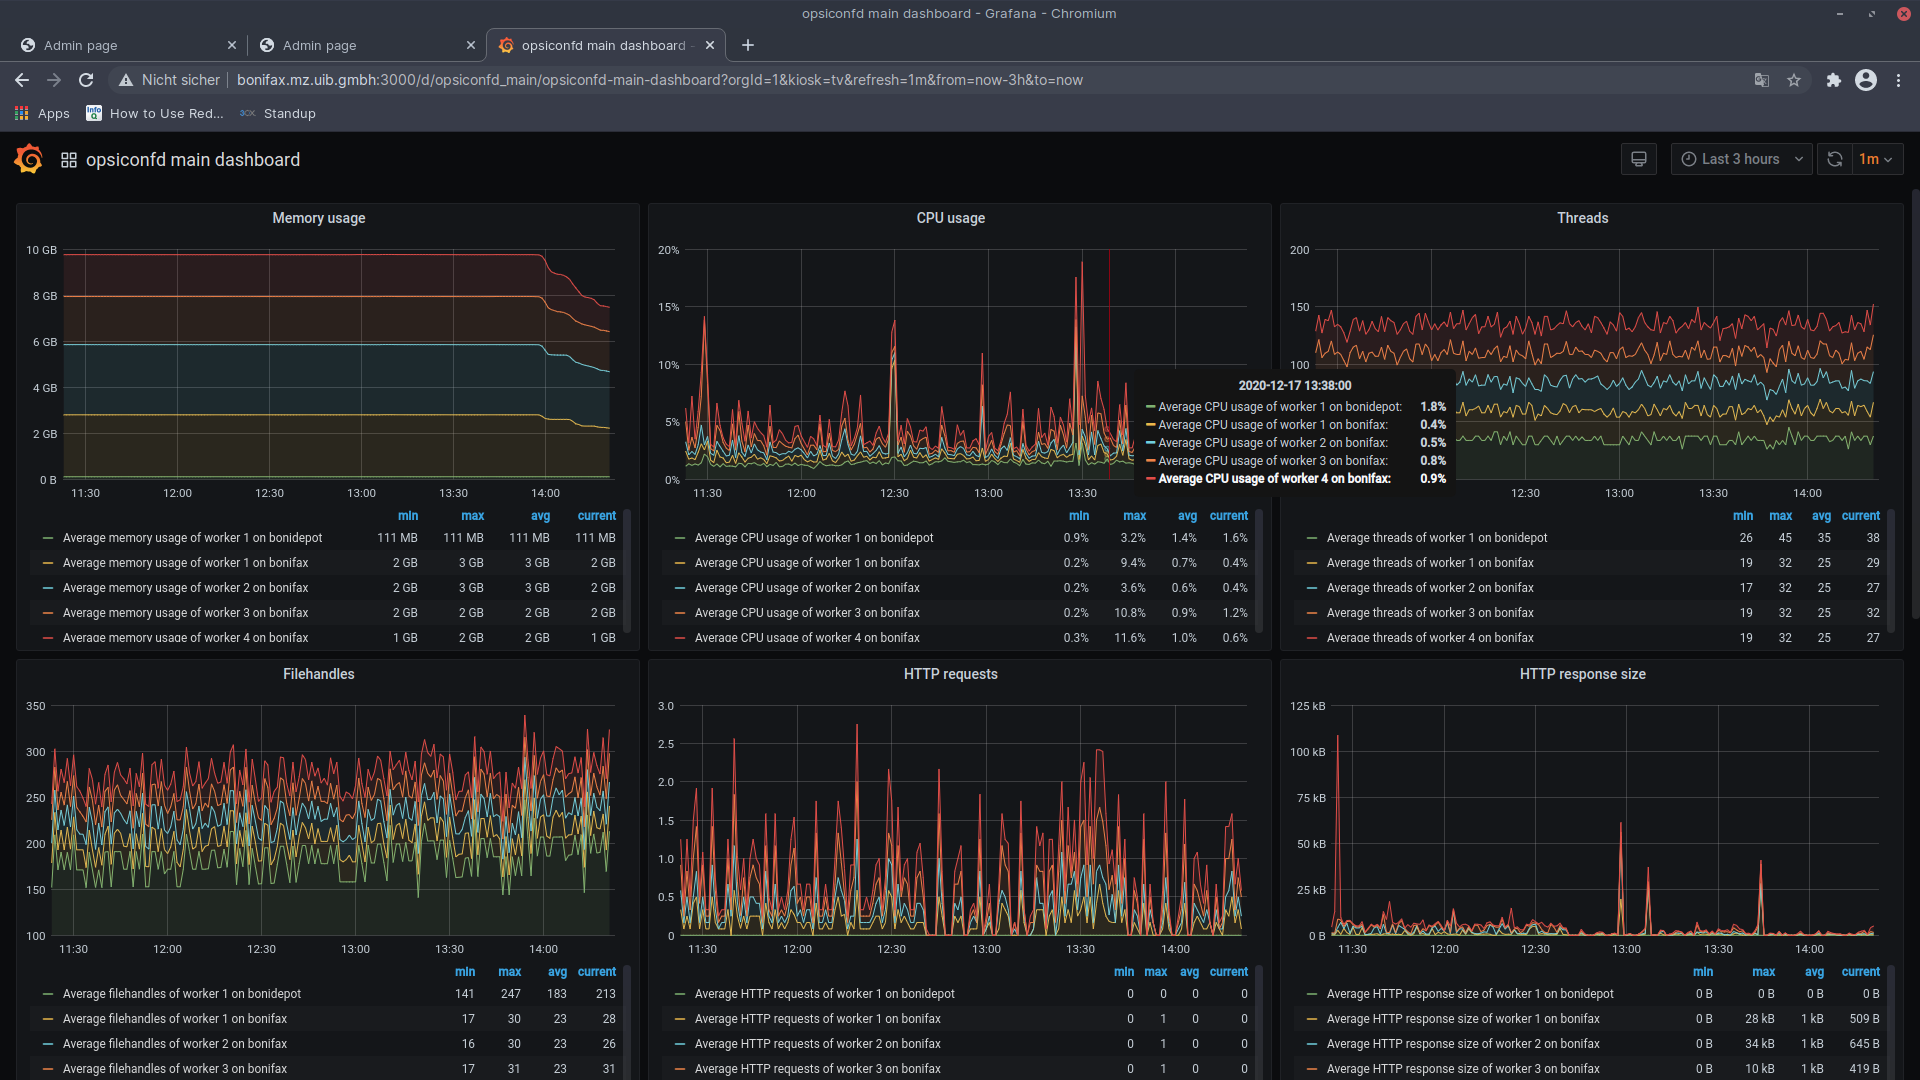
The Grafana web application specializes in visualizing data from various sources, displaying it through browser-based dashboards. Since the release of opsi 4.2, the Grafana server has been used to present performance metrics of the opsiconfd service. You can access the Grafana dashboard through the Admin Page, under the Grafana tab. When you click on this tab, the opsiconfd main dashboard is either created or updated on the Grafana server. Additionally, the user opsidashboard is generated for dashboard access.
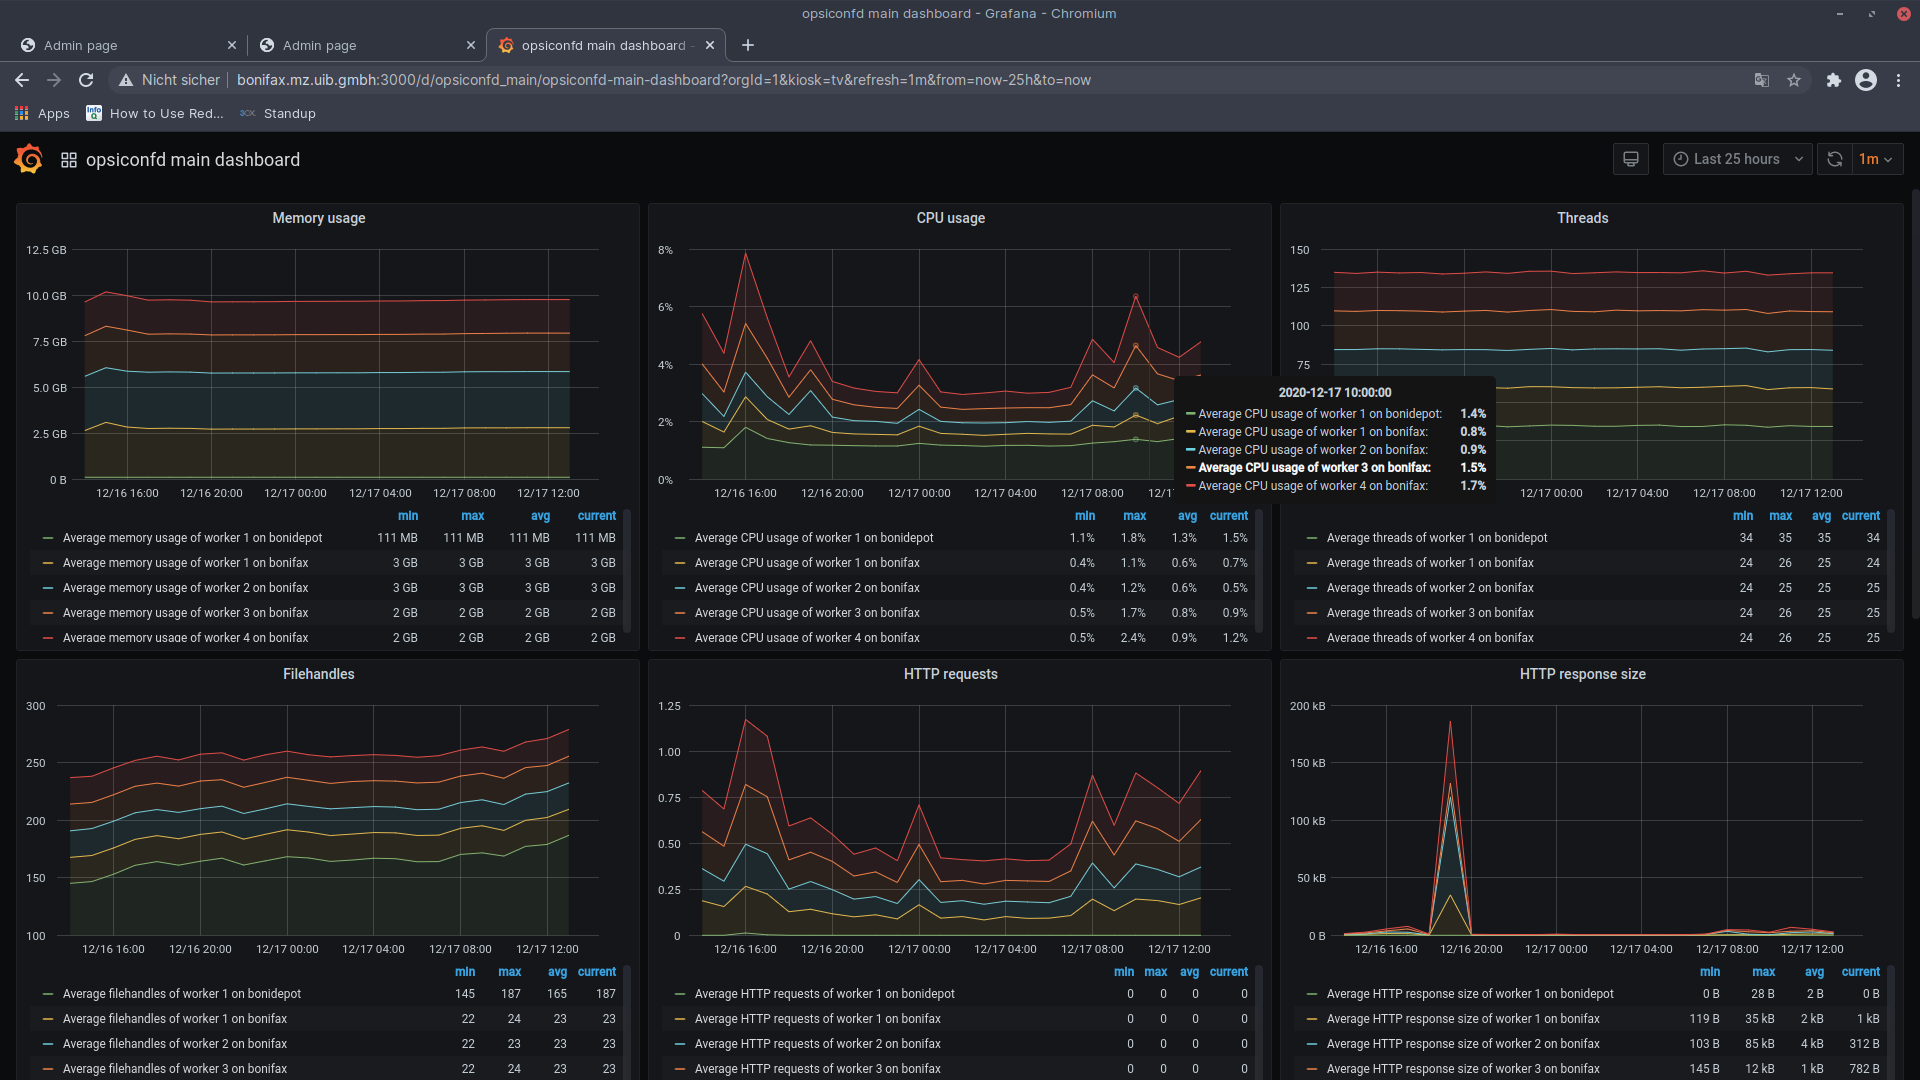
The default time range displayed is Last 5 minutes, but you have the option to customize this view. To do so, click on the time range field in the top right-hand corner of the dashboard. A menu will appear, allowing you to set either an absolute time period (using the From and To fields) or a relative time period starting from the current time (options like Last 5 minutes, Last 15 minutes, etc.). After making your selection, click on Apply time range to update the display.
Grafana is not required on opsi depot servers. For these servers, it is recommended to install either the opsi-server or opsi-server-expert packages instead of the opsi-server-full package. Neither opsi-server nor opsi-server-expert includes Grafana as a dependency.
|
Configuration
The opsiconfd service connects to the central Grafana instance using the URL http://<api-key>@grafana:3000. This configuration is specified in the file /etc/opsi/opsiconfd.conf:
grafana-internal-url = http://opsiconfd:SbihIuvo@localhost:3000To connect an external Grafana instance, specify it using the --grafana-external-url parameter. As illustrated in the previous example, you can include the access credentials for Grafana directly in the URL.
If you make changes to the opsiconfd configuration, you can apply these changes by executing the command sudo opsiconfd reload. For more detailed information on configuring the service, refer to the chapter opsiconfd Service.
|