opsiconfd Service
The opsiconfd is the core service on every opsi server, offering various services over HTTPS (port 4447):
-
/rpc: The JSON-RPC API.
-
/dav: WebDAV access for the workbench, repository, depot, and boot directory.
-
/admin: The Admin Page for status information and administrative tasks.
-
/grafana: Reverse proxy access to a local Grafana server (refer to chapter Grafana).
-
/status: Provides a simple status output for monitoring tools.
-
/public: A public file share that doesn’t require authentication.
You can expand opsiconfd with addons. The opsi WebGUI, for instance, is one such addon. More details can be found in the section Addons.
|
Command Line Interface
The opsiconfd has a command line interface that provides the following commands:
-
start: Starts theopsiconfd(default command). -
stop: Stops a runningopsiconfd. -
force-stop: Likestop, additionally terminates active client connections. -
status: Displays the service status (same output assystemctl status). -
restart: Restarts theopsiconfdservice (systemctl restart). -
reload: Sends aSIGHUPsignal to runningopsiconfd(worker) processes. The processes then reload the configuration files. -
setup: Starts a The opsiconfd setup Command. -
log-viewer: Displays theopsiconfdlogs (see section Logfiles) in the terminal. -
health-check: Starts a Health Check. -
diagnostic-data: Writes health check data and information about the environment, which is helpful for analyzing problems, to a file. -
backup: Creates a backup (see section opsiconfd backup/restore). -
restore: Restores a backup (see section opsiconfd backup/restore).
Server Role
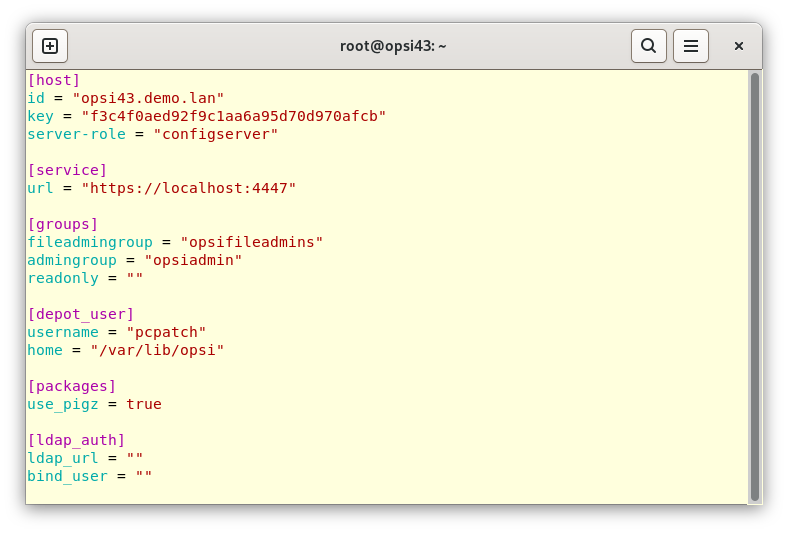
An opsi server can serve as either an opsi config server or an opsi depot server. This role is determined by settings in the configuration file /etc/opsi/opsi.conf. Starting from opsi version 4.3, this configuration file also specifies the server’s ID.
| When operating the opsi server as a Docker container, environment variables determine its behavior. For more information, refer to the section Docker Compose. |
Here is an example configuration for an opsi config server:
[host]
id = "opsi.domain.tld"
key = "5b4324721a114195098bdaf3fab54a9f"
server-role = "configserver"

[service]
url = "https://localhost:4447"
Example configuration for an opsi depot server:
[host]
id = "opsi-depot.domain.tld"
key = "a1b5098fabcaf315b13249cba1a24d17"
server-role = "depotserver"

[service]
url = "https://opsi.domain.tld:4447"
Starting with opsi 4.3, the file /etc/opsi/opsi.conf has replaced the previously used file /etc/opsi/backends/jsonrpc.conf.
|
Configuration
You can configure opsiconfd through the file /etc/opsi/opsiconfd.conf, via environment variables, or via command line parameters. The following precedence applies:
-
Entries in the configuration file override the default settings.
-
Environment variables override entries in the configuration file.
-
Command line parameters take precedence over environment variables.
| To view a list of all available configuration options, enter the following command in a terminal window: |
opsiconfd --help
...
--admin-networks ADMIN_NETWORKS [ADMIN_NETWORKS ...]
                A list of network addresses from which administrative connections are allowed.
                [env var: OPSICONFD_ADMIN_NETWORKS]
                (default: ['0.0.0.0/0', '::/0'])
...
When specifying a command line parameter (such as --admin-networks), the corresponding environment variable is named in capital letters (in this case, ADMIN_NETWORKS). If you exclude the two preceding hyphens --, the result is the name used for the option in the configuration file (admin-networks).
-
For example, the configuration file
/etc/opsi/opsiconfd.confshows:
admin-networks = [10.1.1.0/24,192.168.1.0/24]-
To set it up using the environment variable, follow this approach:
OPSICONFD_ADMIN_NETWORKS="[10.1.1.0/24,192.168.1.0/24]"-
To execute the command on the command line, use the following format:
opsiconfd --admin-networks 10.1.1.0/24 192.168.1.0/24
Most configuration changes can be applied while the system is running by using the opsiconfd reload command. However, certain parameters may require a restart of the service, which can be done with opsiconfd restart.
|
The hostcontrol.conf File
You can manage opsi clients using the HostControl functionality. In opsi 4.3 and later versions, this is primarily done through the opsi message bus. However, the older method is still available, where the opsi config server connects directly to the client agent and executes commands over this connection. Wake on LAN (WOL) can be used to send packets in the network to power on clients if needed.
The configuration for HostControl is located in the file /etc/opsi/backends/hostcontrol.conf. The available parameters in this file include:
-
useMessagebus: This parameter controls how the opsi message bus is used for HostControl. Allowed values are:-
False: The opsi message bus is not used. Instead, a direct connection to theopsi-client-agentis established for each command. -
True: HostControl operations solely rely on the opsi message bus. Clients not connected to the opsi message bus are deemed unreachable, and commands targeting these clients are not executed. This setting is preferred if all clients are configured to use the opsi message bus. -
hybrid(default): The opsi message bus is used for clients with an active message bus connection. If a client lacks such a connection, HostControl establishes a connection to theopsi-client-agent.
-
-
opsiclientdPort: The network port used to connect to anopsi-client-agent. -
hostRpcTimeout: The time limit, in seconds, for establishing a connection to anopsi-client-agent. -
resolveHostAddress: This setting manages name resolution:-
True: Prefers name resolution to determine the IP address of the opsi-client when establishing a connection from the opsi config server to theopsi-client-agent. -
False: Favors using the IP address stored in the opsi backend when establishing a connection.
-
-
maxConnections: The maximum number of concurrent connections to client agents. -
broadcastAddresses: This parameter defines network addresses for sending WOL (Wake on LAN) packets. It maps network addresses to broadcast addresses in the following format:
{ "<network-address>": { "<broadcast-address>": <port-list> } }
Here is an example to illustrate the configuration:
"broadcastAddresses": {
                "0.0.0.0/0": {
                        "255.255.255.255": [7, 9, 12287]
                },
                "10.10.0.0/16": {
                        "10.10.1.255": [12287],
                        "10.10.2.255": [12287]
                },
                "10.10.3.0/24": {
                        "10.10.3.255": [12287]
                },
                "192.168.1.0/24": {
                        "192.168.1.255": [12287, 9, 12287]
                }
        }
Multiple broadcast addresses can be linked to a single network address. For each of these broadcast addresses, different ports can be set up. The suitable broadcast addresses are selected based on the client’s IP address as recorded in the opsi backend. If the IP address falls within the range of several networks, the entry with the most specific match is used.
The opsiconfd setup Command
The opsiconfd service performs automatic adjustments to the opsi environment each time it is started. As a result, manual configuration and maintenance efforts are typically minimal.
The setup tasks included in opsiconfd setup encompass various essential operations:
-
Automatic updating of configuration files.
-
Adjustment of system resource limits (
ulimit). -
Creation of necessary users and groups.
-
Generation of required files and directories.
-
Configuration of the
/etc/sudoersfile. -
Setting permissions for files and directories.
-
Cleanup of logfiles.
-
Configuration of systemd.
-
Setup and maintenance of the MySQL database, including schema upgrades and cleanups.
-
Automatic migration from the file backend to the MySQL database.
-
Configuration and cleanup of Redis.
-
Customization of Grafana configuration and installation of addons.
-
Creation and renewal of the opsi-CA and TLS server certificate.
-
Configuration of the DHCP server.
-
Configuration of Samba and creation of shares.
To manually initiate a setup run at any time, use the following command:
opsiconfd setupA full setup is initiated now; however, to speed up the service start-up, a reduced setup run is executed during the "normal" opsiconfd start.
The opsiconfd parameter skip-setup can be used to permanently disable setup tasks.
|
Typically, opsiconfd setup operates non-interactively. Nevertheless, it also supports interactive tasks for specific purposes:
-
Manual configuration of a MySQL database connection (
--configure-mysql), detailed in chapter MySQL. -
Manual registration of an opsi depot server (
--register-depot). -
Renaming an opsi config server (
--rename-server).
To ensure opsiconfd setup runs without any user interaction, particularly useful in scripting contexts, you can use the --non-interactive parameter.
|
Admin Page
The opsiconfd admin page, accessible in a web browser, offers status information and administrative tasks for opsiconfd. To access it, go to https://<opsi-server>:4447/admin. It’s important to note that users must be part of the opsi admin group to gain access (detailed in chapter Authorizations). The subsequent sections provide a brief overview of each individual tab available on the admin page.
Info
On the Info tab, you can view general information about opsiconfd. This includes the number of connected depot servers and clients, as well as details about the opsi-CA and the server certificate.
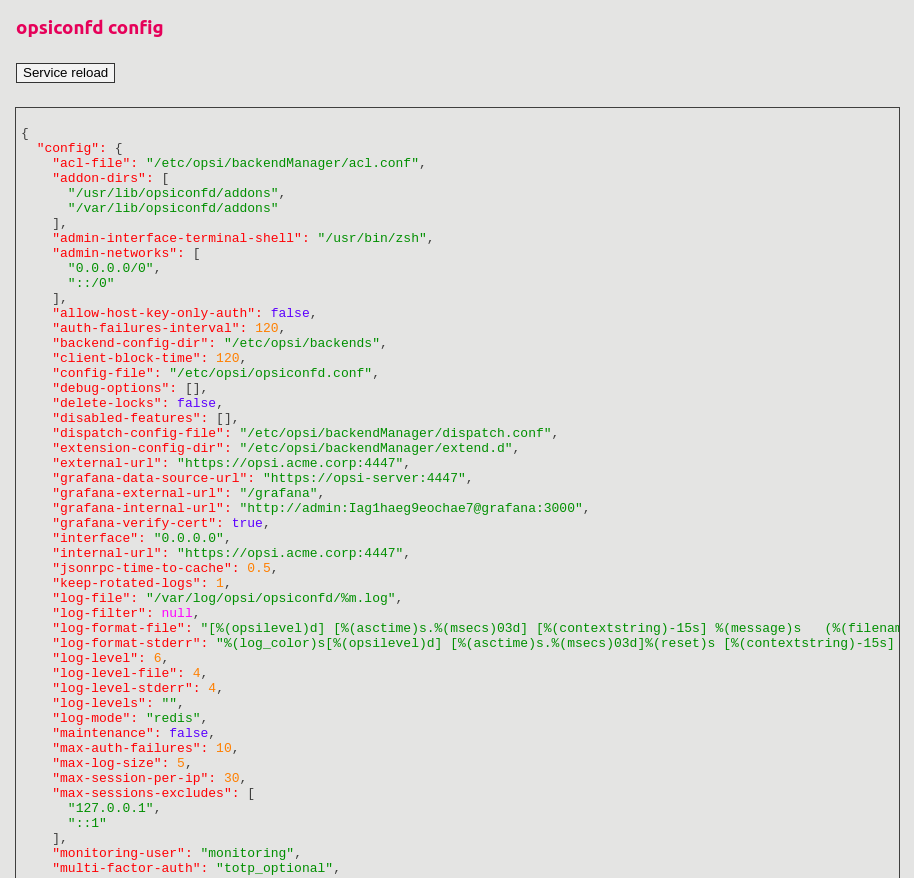
In the lower section of this tab, the opsiconfd configuration is displayed. You have the option to reload this configuration using the Service reload button.
Maintenance
On the Maintenance tab, you can put opsiconfd into maintenance mode and later end it. During maintenance mode, client activities are paused. To activate maintenance mode, click on Set application to 'maintenance' state. Once activated, you will see the message "accomplished": true displayed at the top, along with IP addresses that are exempt from maintenance mode. Typically, these are the localhost IP 127.0.0.1 and the IP address of the opsi config server. Access from other computers is blocked during this time, and users attempting to connect will see a message stating Maintenance mode, please try again later.
| If you wish to allow access from additional IP addresses during maintenance mode, you can specify them in the Address exceptions (optional) field. If entering multiple IP addresses, separate them with commas. |
To deactivate maintenance mode and resume normal operation, click on Set application to 'normal' state.
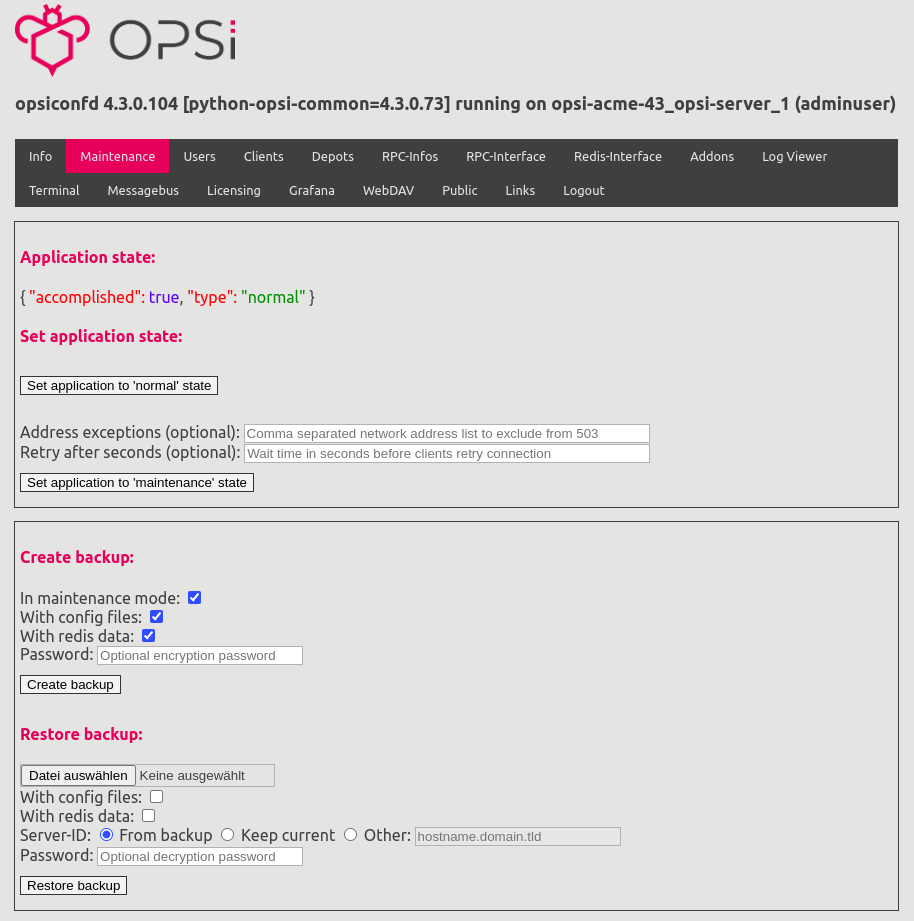
| By default, the opsi config server automatically enters maintenance mode when you create a backup or restore from a backup copy. This process is outlined in the chapter Backup of the opsi Server. |
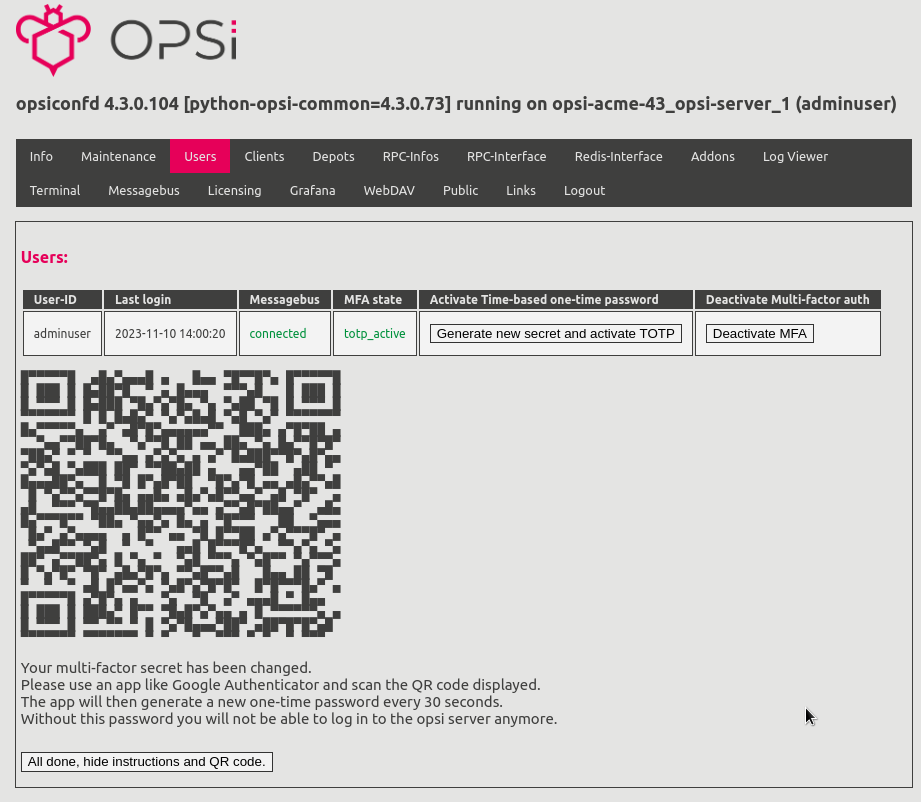
Users
On this tab, you manage the setup of two-factor authentication (2FA) for users on the opsi config server. Once you have appropriately configured opsiconfd and restarted the service, you can initiate 2FA by clicking the Generate new secret and activate TOTP button. This action generates a one-time password comprised of six digits, which will be required in addition to the usual login credentials for accessing the opsi server. More details about this process are available in the section Two-Factor Authentication.
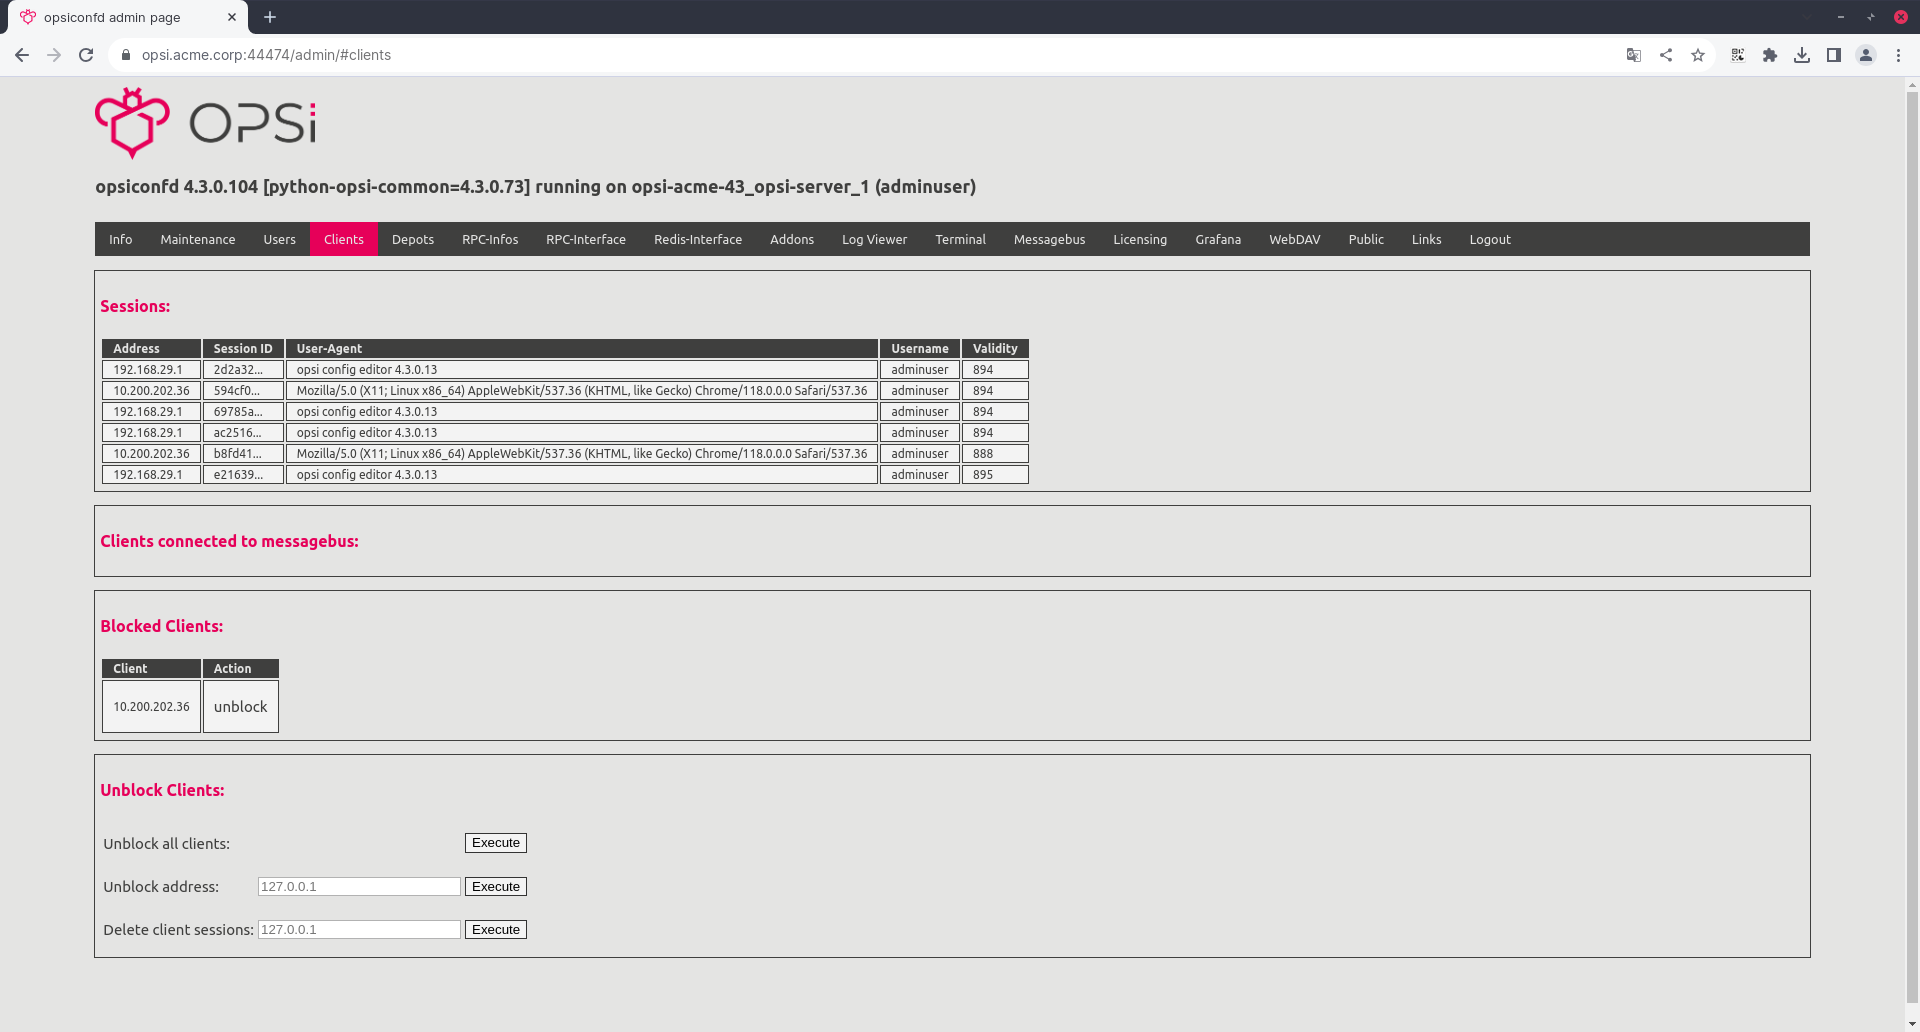
Clients
The tab displays information about connected clients and their sessions. Clients that have been blocked are listed under Blocked clients. To unblock an individual client, use the Unblock clients section by entering their IP address and clicking Execute. Alternatively, you can unblock all clients at once using the Unblock all clients button.
| It’s important to understand that "clients" here refers to (web) clients accessing the admin page, not the computers managed with opsi. This admin page feature typically blocks a client due to multiple failed login attempts. |
To delete all sessions associated with a specific client, enter its IP address in the Delete client sessions field and click Execute to confirm.
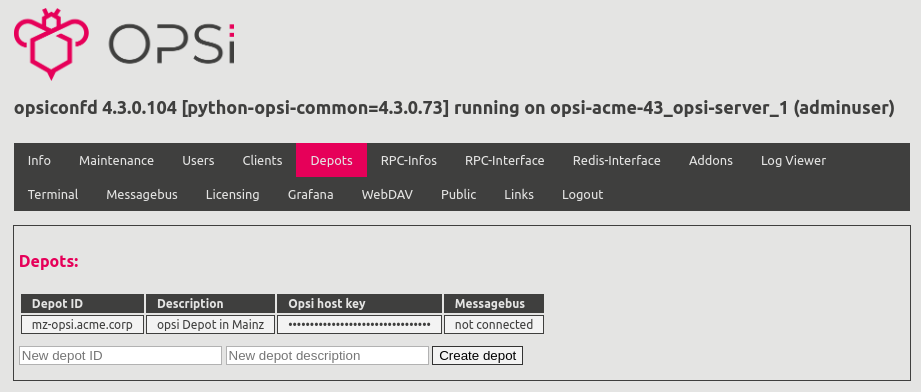
Depots
In the upper section of this tab, you have the option to add additional depot servers to your opsi environment. Start by entering the depot ID (which is the FQDN of the opsi depot server) and a brief description in the provided fields. After clicking on Create depot, the new depot should appear in the table. Initially, the Messagebus column will display not connected. To establish communication between the config server and the new depot server, you need to execute the following command on the depot server:
opsiconfd setup --register-depot
Please note that the command opsi-setup --register-depot is no longer available after the transition from opsi version 4.2 to 4.3 (see the section opsi-setup).
|
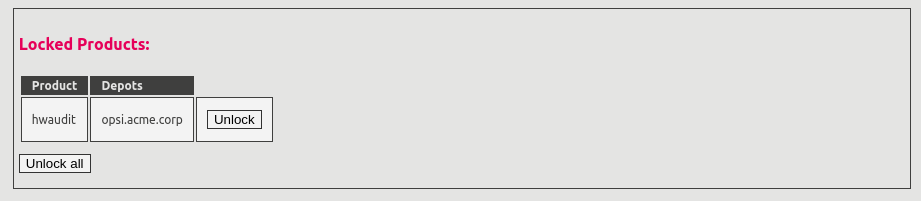
If there are locked products on a depot server, they will also appear in the Locked Products section of this tab. You can unlock a specific product by clicking the Unlock button next to it. To remove the lock on all products, use the Unlock all button.
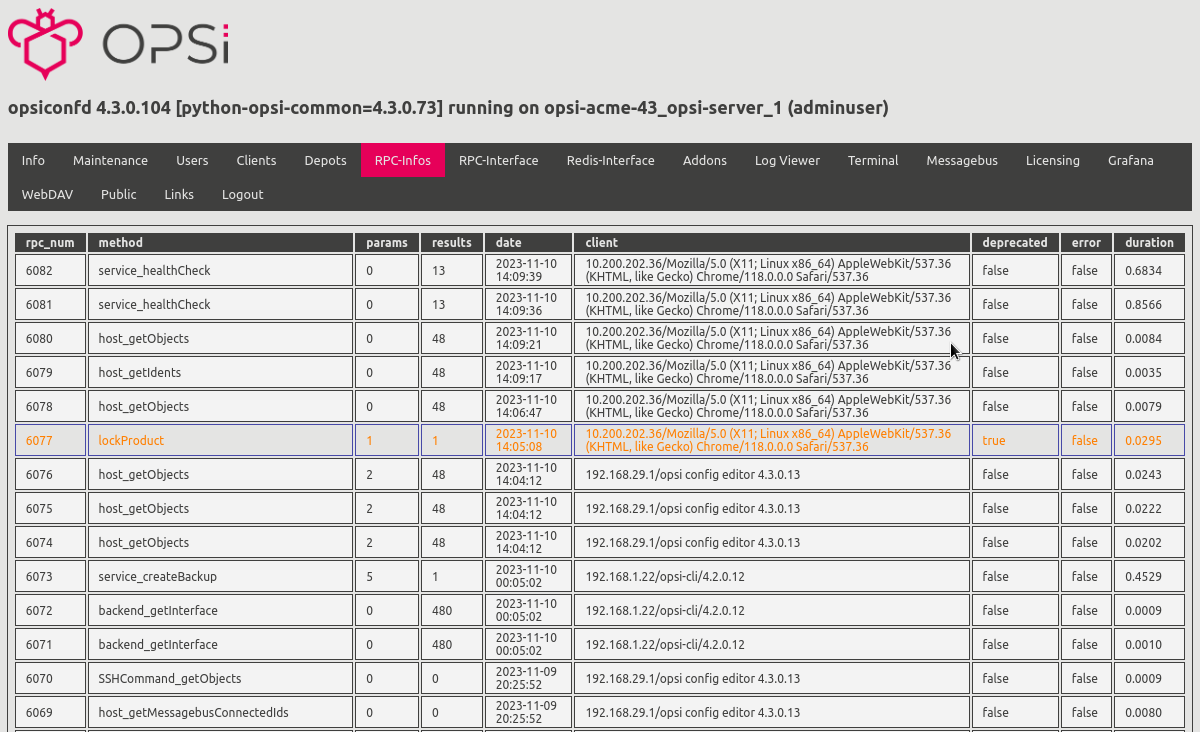
RPC Infos
The table displayed on this tab chronicles the most recent RPC (Remote Procedure Call) activities. You can organize the data by clicking on the headers of the table columns to sort the information accordingly.
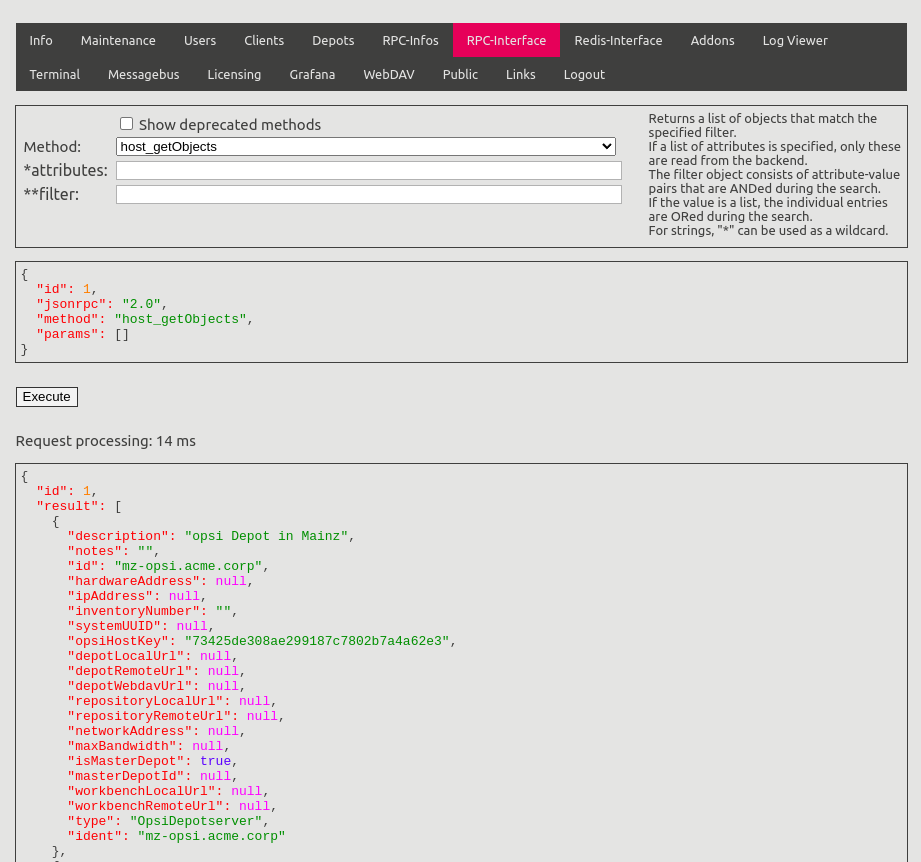
RPC-Interface
This tab provides a comprehensive list of all methods available in the JSON-RPC API. By selecting the Show deprecated methods checkbox, you can also view methods that are deprecated. To explore a specific method, choose one from the Method drop-down menu. Depending on the selected method, you may see additional input fields for attributes, filters, or parameters. These fields require valid JSON encoding, and any syntax errors will be highlighted by the interface.
When you click the Execute button, the selected method will be executed. The request, processing time, and result will then be displayed below in JSON format.
Redis Interface
On this tab, you can view Redis status information, execute Redis commands, and clear the cache. By clicking on Info+, you can access detailed information about the Redis version, operating system, server architecture, and more.
The responses to any actions or queries you perform on this tab will be displayed at the bottom in JSON format.
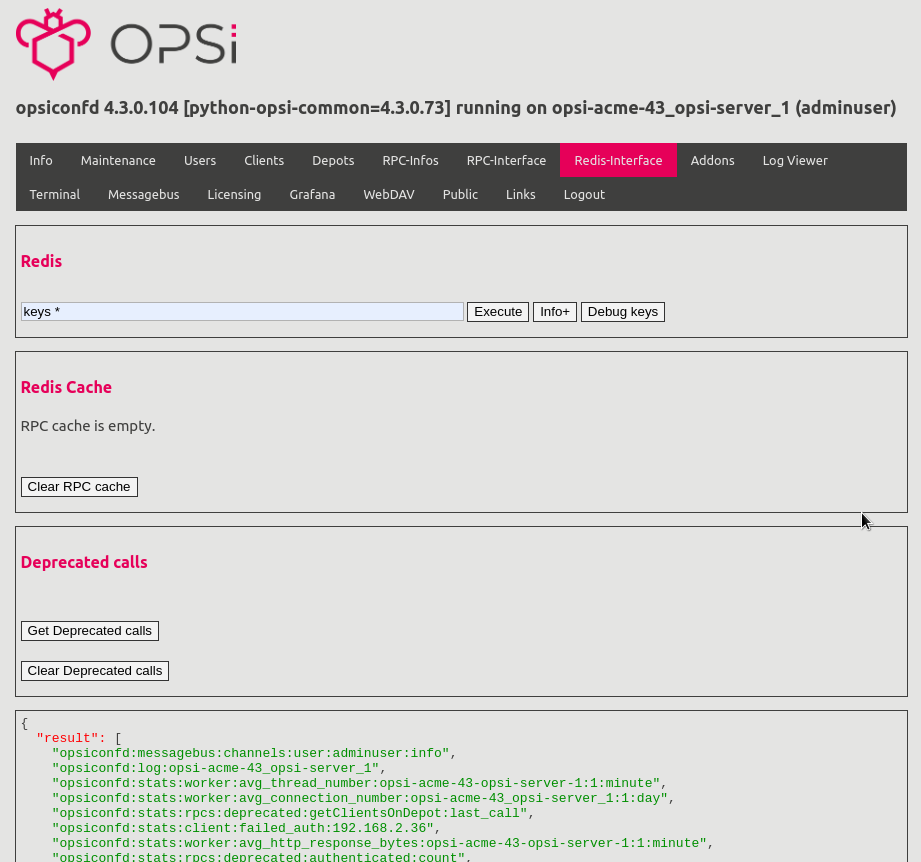
| The Debug keys button allows you to debug keys, which are the names of various data structures stored in the database. This function can be useful for troubleshooting, performance monitoring, or data analysis. However, it’s important to be cautious as accidentally deleting or overwriting a key could result in data loss. If you’re unsure, it’s advisable to create a backup beforehand (see the chapter Backup of the opsi Server). |
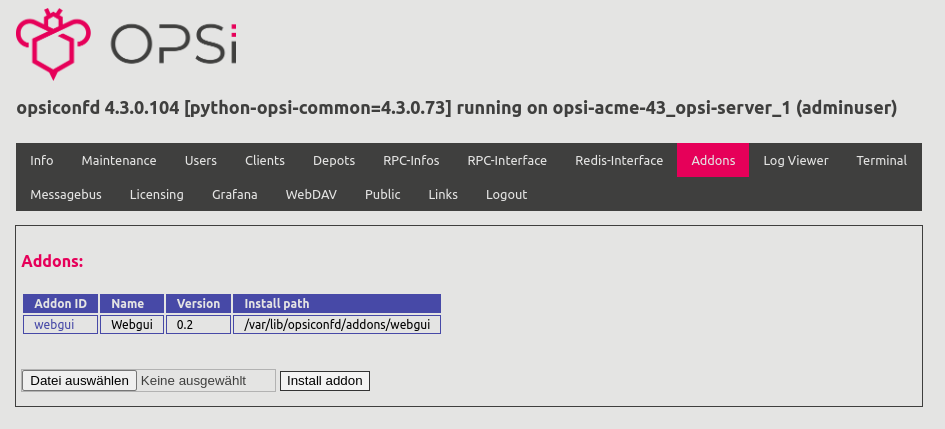
Addons
On the Addons tab, you manage the installation of opsiconfd extensions. Initially, download these extensions from our opsi Tools Website and save them onto the opsi server. To install an addon, click Browse on the Addons tab, then in the file selection dialog, navigate to the zip file, select it, and finally click on Install addon.
The table on this tab not only shows the name and ID of each installed extension but also displays their version number and the installation path on the server.
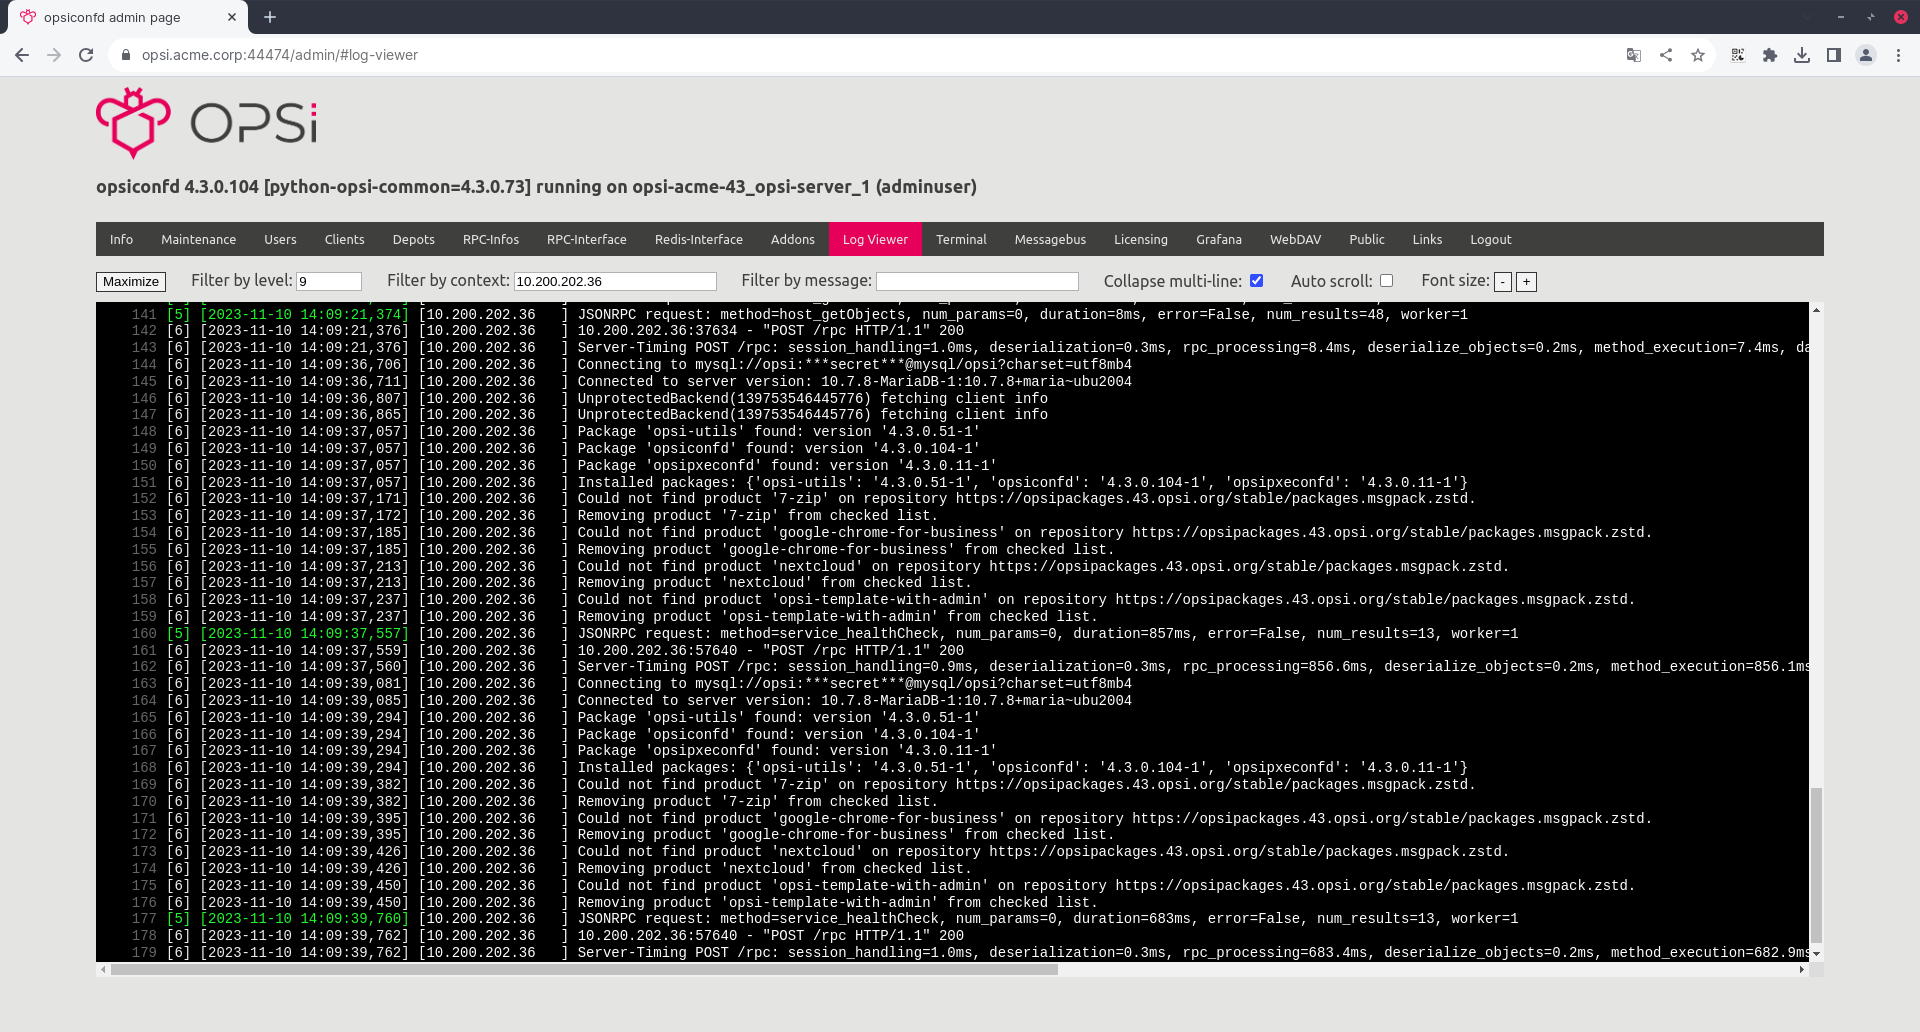
Log Viewer
The tab offers quick access to the opsiconfd logfiles (refer to section Logfiles). Enhance your viewing area with the Maximize button, and apply filters to the logs based on log level (Filter by level), context (Filter by context), or specific search terms (Filter by message). Use checkboxes for additional functionalities like condensing multi-line entries into single lines (Collapse multi-line) and enabling automatic updates to the display (Auto scroll). Adjust the font size for ease of reading using the buttons next to Font size.
Terminal
Navigate to this tab to launch a terminal window on the opsi server. Start by selecting an opsi server from your environment using the Host drop-down menu (the default is set to Configserver). Then, click on Connect. This action will open the terminal within the browser, where you will be logged in as the user opsiconfd and positioned in its home directory, /var/lib/opsi.
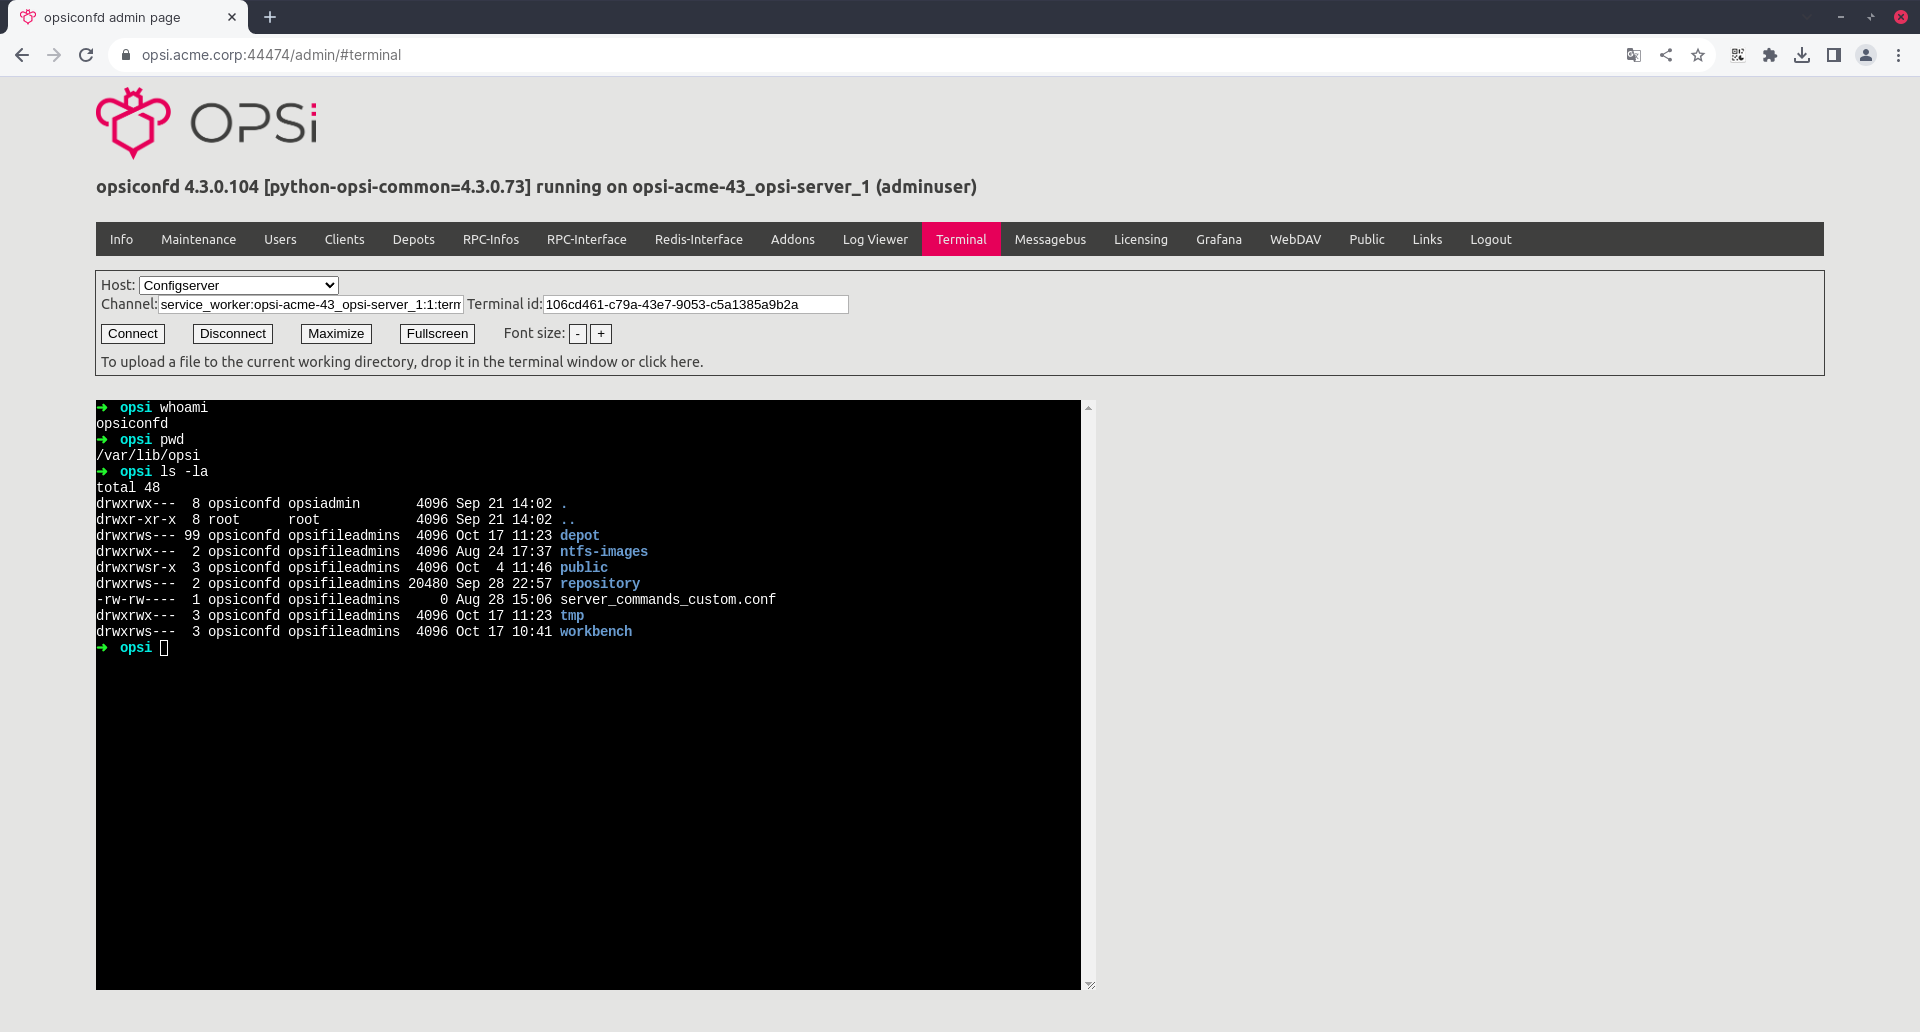
To expand the terminal window, click the Maximize button, which hides the top menu of the admin page for more space. To revert to the original view, select Normalize. For an even larger display, choose Fullscreen, which can be exited by pressing [Esc]. The font size within the terminal can be adjusted using the plus and minus buttons next to Font size, and you can close the terminal in the browser by clicking on Disconnect.
Uploading files to the terminal is straightforward—either click or drag and drop them into the terminal window. This feature is particularly useful for installing self-built opsi packages with the .opsi file extension. Follow these steps to proceed:
|
-
Open the terminal in the browser.
-
Change to the directory with the packages:
cd /var/lib/opsi/repository -
Drag the package from the file manager into the browser terminal. (
ls -llists all files in the current directory for checking purposes.) -
Install the package:
opsi-package-manager -i <package.opsi>(see also section opsi-package-manager)
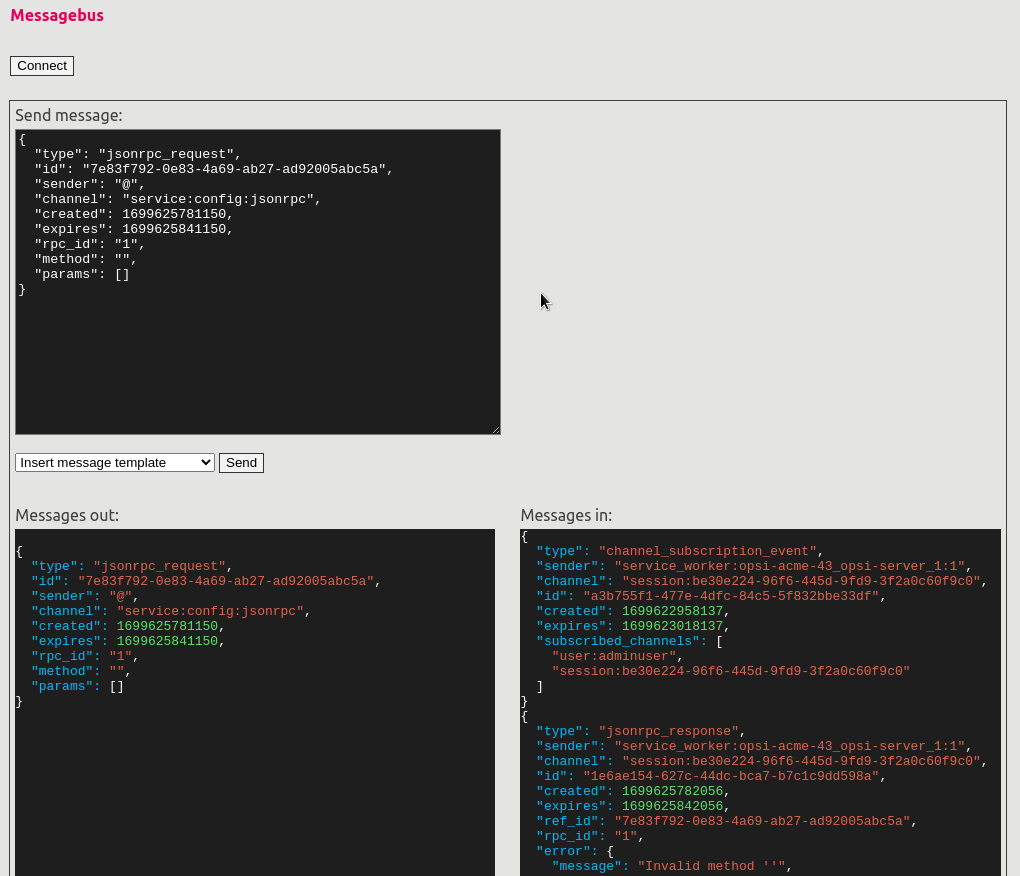
Messagebus
On this tab, you can send and receive messages via the message bus, primarily for testing and debugging purposes. The opsi server uses the message bus to communicate with other components, such as sending installation jobs, configuration changes, or status queries to clients.
To use this feature, choose a template from the drop-down menu next to the Send button and input the appropriate values in the upper field. After filling out the template, click on Send. In the lower section of the tab, you will see the message you sent on the left and the response from the opsi message bus on the right.
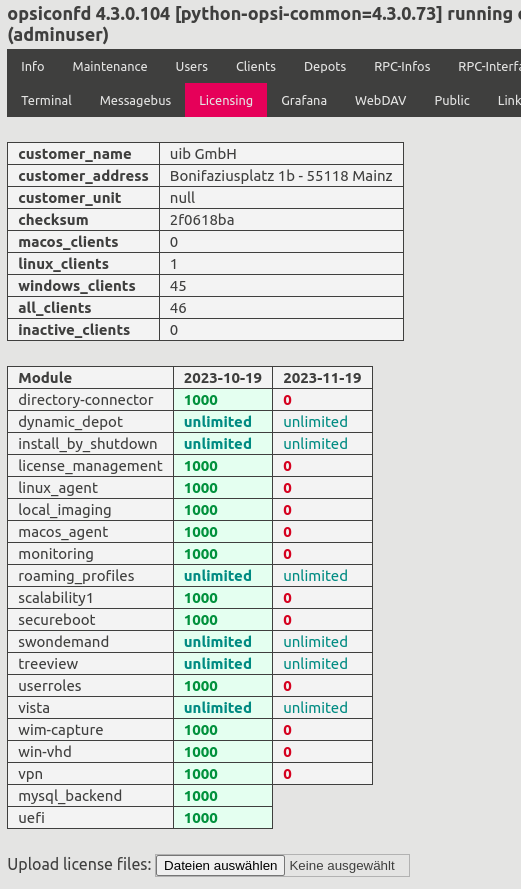
Licensing
On the Licensing tab, you can view the licensing status of various opsi Extensions. The first table on this tab provides details about the licensee, including information like name, number of active and non-active clients, and more. Further down, you will find a detailed list of opsi modules, showing data such as when a license was issued and its validity period.
At the bottom of the tab, there is an option to import new licenses in the .opsilic format. Once imported, these licenses are stored on the opsi server in the /etc/opsi/licenses directory.
Previous versions of opsi used the /etc/opsi/modules file for activation purposes. While this method remains valid, new licenses are now issued exclusively in the new format. If you require a license file in the new format, please contact sales@uib.de for assistance.
|
Grafana
The Grafana tab serves as a direct link to the Grafana dashboard. When you select this tab, the opsiconfd main dashboard on the Grafana server is either created or updated. Additionally, this action creates the opsidashboard user, who has access to the dashboard.
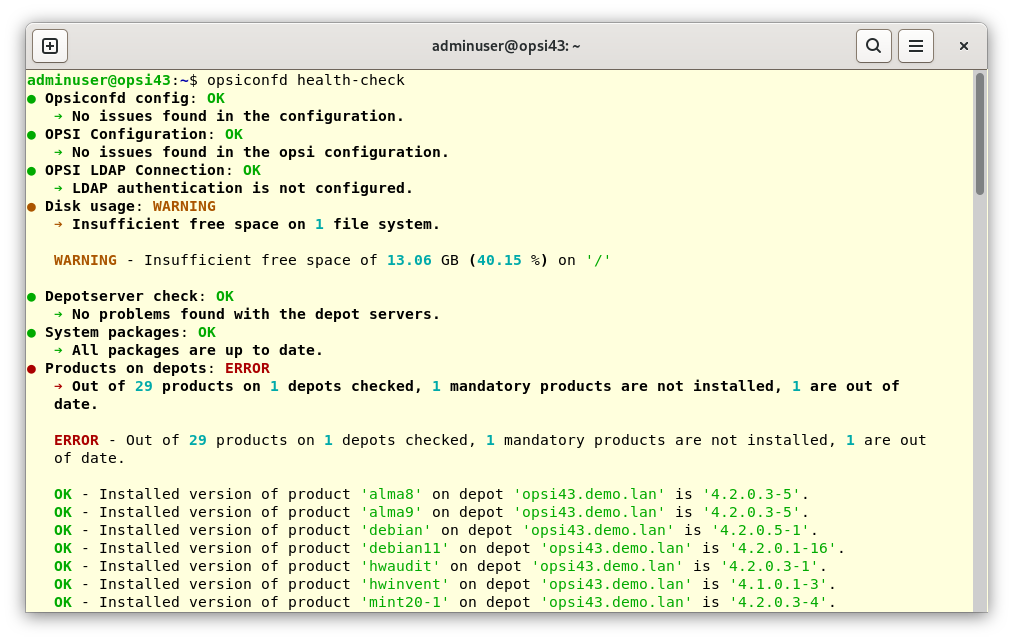
Health Check
The opsiconfd includes a health check feature that can inspect various settings and versions of opsi components, offering insights into potential issues. This health check can be initiated in several ways, with all methods sourcing data from the API call service_healthCheck. The opsi API delivers this data in JSON format, which is particularly useful for support inquiries.
One method to perform a health check is through the admin page, specifically on the RPC-Interface tab (refer to section RPC-Interface). Alternatively, you can execute the health check via the command line with the command opsiconfd health-check. To access online help, use the --help parameter. For a detailed description of all available checks, enter opsiconfd health-check --manual. Running the command without additional options performs the check once and outputs the results to stdout.
Alternatively, you can also start the health check with the command line tool opsi-cli (see section opsi-cli support). The admin page provides quick access to a terminal on the opsi server via the Terminal tab (see section Terminal).
|
Logfiles
The opsiconfd uses Redis to write the logfiles (see chapter Redis). In addition, the opsiconfd stores its own logfiles in the directory /var/log/opsi/opsiconfd.
If there are problems accessing Redis, no logging takes place. To generate logfiles anyway, you can set the log-mode parameter to local.
|
opsi uses 10 distinct log levels for its logging system:
-
0 - nothing: Logging is completely deactivated.
-
1 - essential: Logs very important messages only.
-
2 - critical: Captures critical errors.
-
3 - error: Logs standard errors.
-
4 - warning: Records warning messages.
-
5 - notice: Logs important information.
-
6 - info: Provides additional information.
-
7 - debug: Contains messages useful for troubleshooting.
-
8 - trace: Offers a detailed record, such as communication logs.
-
9 - secret: Logs confidential information.
The log level in opsi is controlled by the following parameters:
-
log-level: This sets the general log level, determining up to which level messages are sent to the Redis stream.
-
log-level-stderr: This specifies the log level for output to the terminal (Stderr).
-
log-level-file: This defines the log level for entries in the logfiles.
Use the command opsiconfd log-viewer to view the logs in the terminal:
opsiconfd log-viewer -l 6 --log-filter="client_address=192.168.1.1"Since the command accesses the log stream directly from Redis, the output is restricted to the 'log level' setting.
Alternatively, you can review the logfiles using the Log Viewer tab in the admin interface. For detailed information on this feature, refer to the section Log Viewer.
Filter
The opsiconfd categorizes logfiles into channels and contexts, allowing for targeted filtering of log messages. You can specify the log level for a particular channel using the log-levels parameter. For instance, setting .*:4,opsiconfd\.headers:8 logs only warnings for most channels, but logs messages in the opsiconfd.headers channel at the more detailed trace level.
For context-based filtering, use the log-filter parameter. The context client_address is mainly used in opsiconfd. For example, by setting client_address=192.168.1.1,192.168.1.2, you can filter the log to show messages related only to the clients with IP addresses 192.168.1.1 and 192.168.1.2.