Health Check & Monitoring
OPSI offers a health check that checks the operating status of the OPSI server. This health check can be called up via the web interface of the OPSI server, for example. The health check checks the functionality and provides an overview of the status of the various components of the OPSI server.
The health check can be integrated into a monitoring system in order to monitor the status of the OPSI server.
Health Check
The opsiconfd provides a health check that can check various settings and versions of OPSI components and thus provide information on possible problems. The health check can be started in different ways. All variants obtain their data from the API call service_healthCheck. The OPSI API returns the data in JSON format. Such a JSON file is particularly useful for support requests.
One way to start a health check is via the admin page, RPC interface tab (see section RPC Interface). The WebGUI also provides quick access to the Health-Check. On the command line, the call is made via the command opsiconfd health-check. The parameter --help is used to display a help text; opsiconfd health-check --documentation displays a description of all checks. Without further options, the check runs once and writes its results to stdout.
opsiconfd health-check --list outputs all available checks with name and ID. A specific check can be executed with opsiconfd health-check --checks <ID>. Checks that are not to be executed can be skipped with --skip-checks <ID>.
The checks and skip-checks can also be configured in /etc/opsi/opsiconfd.conf or via environment variables (OPSICONFD_CHECKS or OPSICONFD_SKIP_CHECKS).
You can start the health check in the terminal. image::server:opsi-health-check.png[“You can start the health check in the terminal.”, width=800, pdfwidth=80%]
The health check can also be started with the command-line tool opsi-cli (see section opsi-cli support). Quick access to a terminal on the OPSI server is provided by the admin page via the Terminal tab (see section opsiconfd Terminal).
|
Output formats
The health check can produce the following outputs:
-
cli (default): Output customized for the command line.
-
json: Output in JSON format.
-
checkmk: Output so that it can be processed by Checkmk.
-
zabbix: Output so that it can be processed by Zabbix.
-
nagios: Output so that it can be processed by Nagios.
The output formats can be controlled via the --format parameter.
opsiconfd health-check --format jsonCaching
The results of the individual checks are saved in Redis and remain valid for 24 hours. Various functions, such as creating a backup, ensure that the cache for the backup check is cleared.
If the health check is called with the --clear-cache parameter, the cache is emptied and all checks are executed again.
The parameter clear_cache can also be passed to the API method service_healthCheck to clear the cache.
{
  "method": "service_healthCheck",
  "params": {
	"clear_cache": true
  }
}
Monitoring
The health check can be integrated into a monitoring system to enable continuous monitoring of system health and performance. The health check can be called up regularly via the monitoring system. The results can be evaluated for various purposes, such as alarms, logs, or the automation of maintenance processes.
Checkmk
To use the results of the health check in Checkmk, one or more "local checks" are set up. Checkmk is a flexible and expandable monitoring tool that has been specially developed for monitoring IT infrastructures. By integrating health check data, administrators can ensure that systems are always in optimum condition and that any problems are detected at an early stage.
The opsiconfd comes with a template shell script that converts the output of the health check into the Checkmk format. This script is contained in the opsi_checkmk file, which can be found under /usr/share/opsiconfd. The file can be integrated into Checkmk as a "local check" in order to regularly collect and evaluate the health check data.
For integration, copy the script to /usr/lib/check_mk_agent/local/<cache-time>, where <cache-time> stands for the cache interval at which the results are updated. After copying, the script must be made executable in order to work correctly.
Here is an example:
cp /usr/share/opsiconfd/opsi_checkmk /usr/lib/check_mk_agent/local/600/opsi_check
chmod +x /usr/lib/check_mk_agent/local/600/opsi_check
In this case, the check results are updated every 600 seconds (10 minutes). The documentation for the Checkmk local checks can be found here: https://docs.checkmk.com/latest/de/localchecks.html
With the parameters --checks or --skip-checks the checks can be customized in the opsi-check script (see section Health-Check).
Nagios / Icinga
To integrate the results of the health check into Nagios or Icinga, the script /usr/share/opsiconfd/opsi_nagios can be used, which converts the output of the health check into a format readable by Nagios/Icinga. The script is copied to the directory /usr/lib/nagios/plugins/ and made executable.
cp /usr/share/opsiconfd/opsi_nagios /usr/lib/nagios/plugins/opsi_check
chmod +x /usr/lib/nagios/plugins/opsi_check
The check script can be passed a parameter to execute the desired health check. The parameters correspond to the IDs of the OPSI checks. For example:
opsi_check mysqlThe list of available checks can be retrieved using the command opsiconfd health-check --list. To get detailed information about a specific check, use opsiconfd health-check --docs.
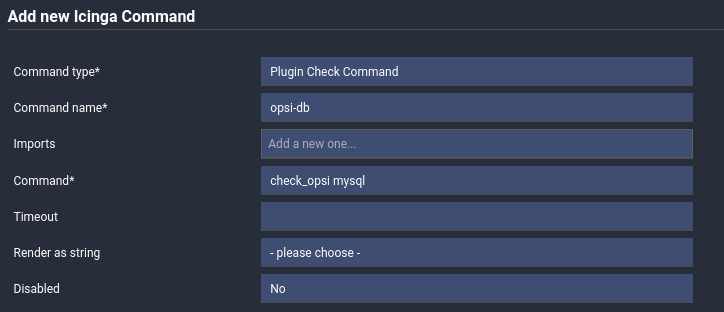
In the Nagios/Icinga configuration, a command is defined that calls this script. Here is an example of an Icinga2 command definition:
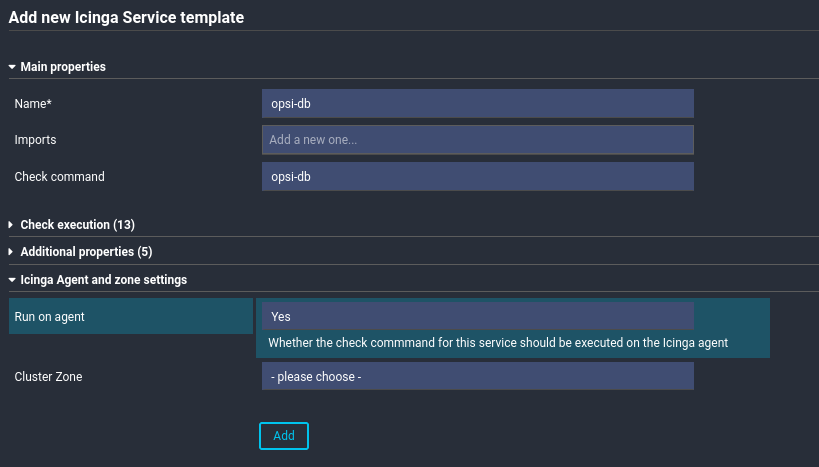
Next, a service is defined that uses this command. Here is an example of a service template definition:
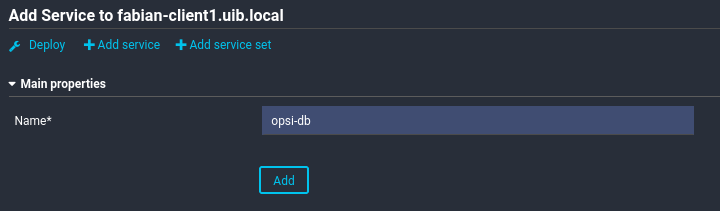
Then, the service is assigned to a host to monitor the health check data. Here is an example of a host definition:
Finally, the configurations are rolled out to activate the changes.
The user under which the Icinga2 service runs needs read access to the file /etc/opsi/opsiconfd.conf to read the configuration of the health check. This can be achieved by adding the user to the opsiadmin group.
|
Further information about Icinga2 can be found in the documentation: https://icinga.com/docs/icinga-2/latest/doc/01-about/
Zabbix
To integrate the results of the health check into Zabbix, so-called UserParameters can be used.
The opsiconfd provides the shell script /usr/share/opsiconfd/opsi_zabbix for this purpose, which simplifies the integration.
Here is an example of a UserParameter that executes the Redis check:
UserParameter=opsi.redis,/usr/share/opsiconfd/opsi_zabbix redisTo find out which checks are available, use the command opsiconfd health-check --list --detailed.
Detailed information about a specific check can be obtained with opsiconfd health-check --docs.
In the Zabbix configuration, you then create an item of type Text that uses this UserParameter.
Select Zabbix Agent as the type and use the name of the UserParameter as the key, in this case opsi.redis.
The update interval can be chosen flexibly, for example 60 seconds, since the results of the health check are cached by opsiconfd in Redis and thus do not cause high system load.
Set the timeout for the item to 10 seconds.
For alerting, set up triggers that evaluate the text of the item.
You should check whether the result starts with OK, WARNING, or CRITICAL to correctly recognize the status.
Downtime
A downtime can be set for certain health checks to allow for temporary failures or maintenance periods without triggering false alarms. The downtime can be set either for a specific check or for the entire monitoring system. This is particularly useful when performing planned maintenance or updates that result in a temporary loss of system availability.
The downtime for a health check can be defined using the following configuration parameters:
-
opsi.check.enabled (default: true) - Enables or disables the health check. If false, the check is not executed.
-
opsi.check.downtime.start (default: zero) - Start time of the downtime in ISO-8601 format (e.g., 2025-03-25T08:00:00).
-
opsi.check.downtime.end (default: null) - End time of the downtime in ISO-8601 format. The end of the downtime determines when the check is reactivated after the specified pause.
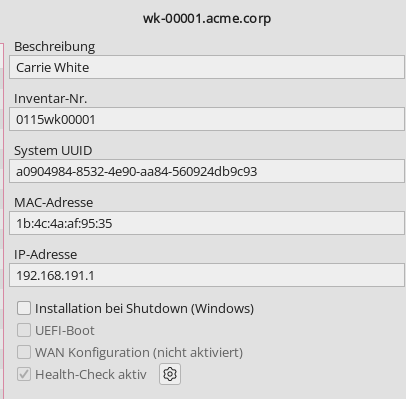
These parameters can be set in the client overview in opsi-configed. In the client details area on the right-hand side, you will find a display with the title Health check active and a cogwheel symbol. You can configure the downtime parameters via this cogwheel icon.
For a detailed description of the health check settings and configurations, you can find further information in the opsi-configed chapter of the documentation (see opsi-configed).