Dashboard
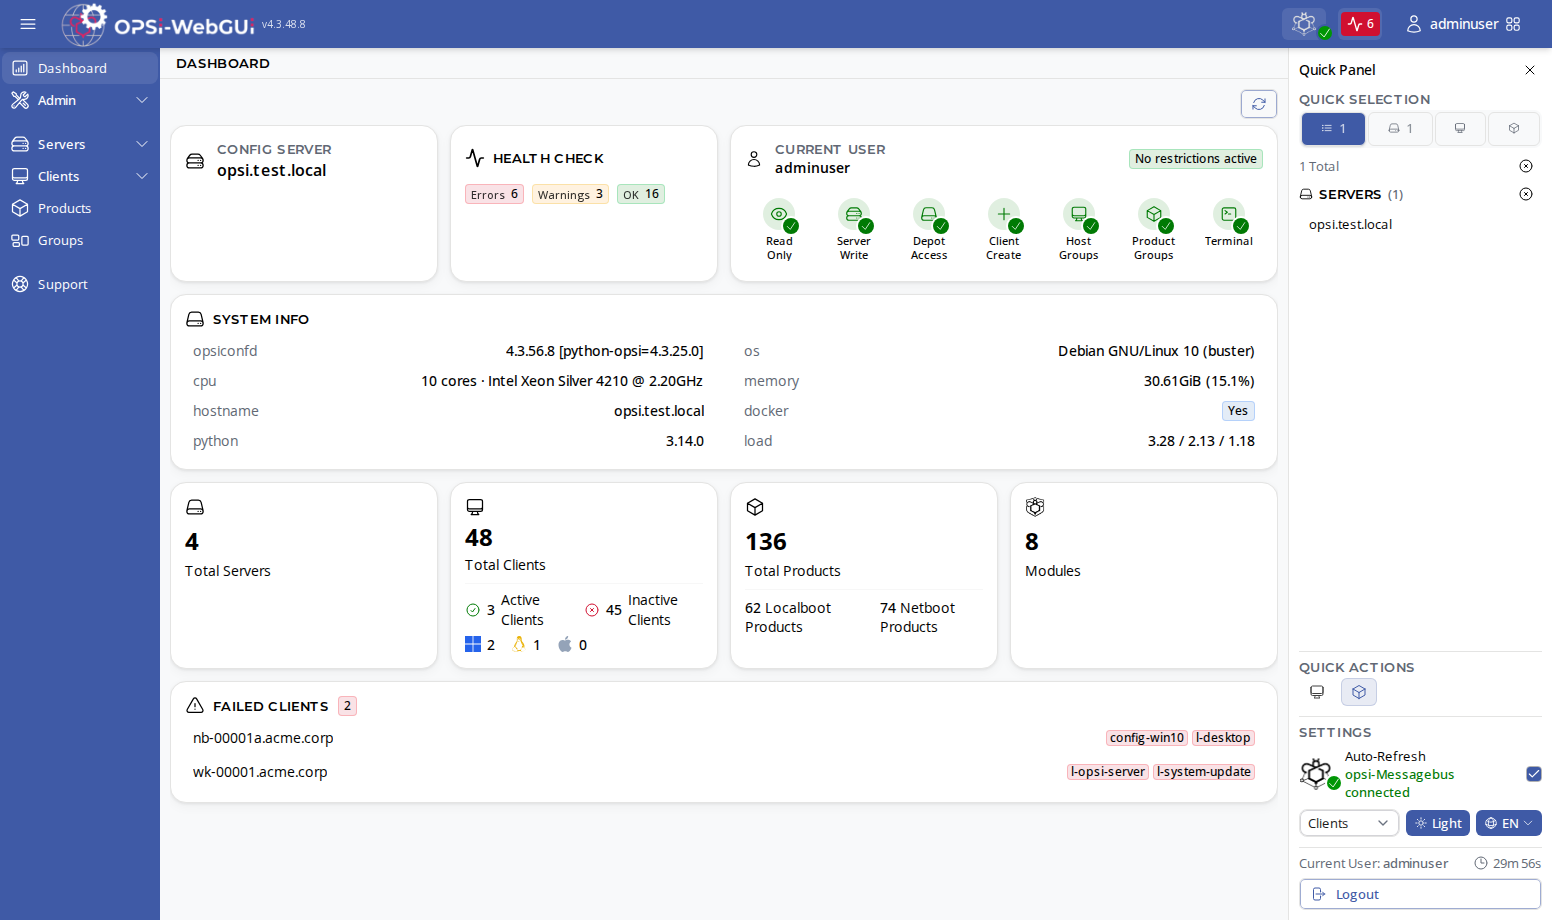
The Dashboard gives a quick overview of your OPSI environment: server status, health, user permissions, and statistics. Most cards are clickable and take you to the corresponding detail page.
Server, Health, and User
-
Config Server: Shows the name of your OPSI config server. Informational only.
-
Health Check: Summarizes the server’s health check with error, warning, and OK counts as colored badges. Clicking the card opens Admin > Diagnostics > Health Check.
-
Current User: Shows your username and your feature permissions as badges: Read Only, Server Write, Depot Access, Client Create, Host Groups, Product Groups, and Terminal. Restricted features are marked accordingly.
System Information
The System Info card shows technical details of the config server; clicking it opens Admin > Diagnostics > System Info:
-
opsiconfdversion and Python version -
Operating system and hostname
-
CPU (number of cores and model) and load average
-
Memory (total and current usage)
-
Whether the server runs inside Docker
Statistics
-
Total servers: Number of OPSI servers (config and depot servers). Clicking opens the Servers page.
-
Total clients: Number of OPSI clients, with active/inactive counts and a breakdown by operating system (Windows, Linux, macOS). Focus or hover the information icon to show the client count per depot and the meaning of the active/inactive counts. Clicking opens the Clients page.
-
Total products: Number of products, split into localboot and netboot products. Focus or hover the information icon to show the product count per depot. Clicking opens the Products page.
-
Modules: Number of enabled OPSI modules. Clicking opens Admin > Diagnostics > Modules.
Failed Clients
If the health check reports clients with failed product actions, an additional card lists these clients together with the failed products as badges. Use it to spot installation problems without opening the Clients page. Focus or hover the information icon for an explanation of how failed clients are determined.